
- Moving the markets
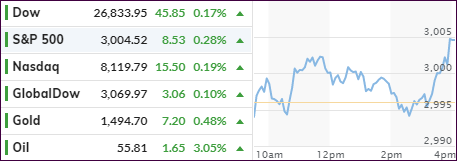
Despite disappointing results from Boeing and Caterpillar, the markets managed an early ramp higher but were not able to sustain it, as a slow deterioration of upward momentum pulled the major indexes back below the unchanged line.
Traders had one eye on the Brexit developments, where the latest parliamentary vote eased concerns about the UK busting out of the EU without a deal by October 31st.
Looking at the big picture, this week is all about earnings with next week’s highlight being the Fed meeting on interest rates. Even though 82.7% of S&P companies have delivered results above expectations, let’s not forget that these expectations have been sharply reduced.
Companies are further justifying these numbers by elaborating that “how we did this quarter isn’t as important as what we expect the future to hold.” Yeah, right.
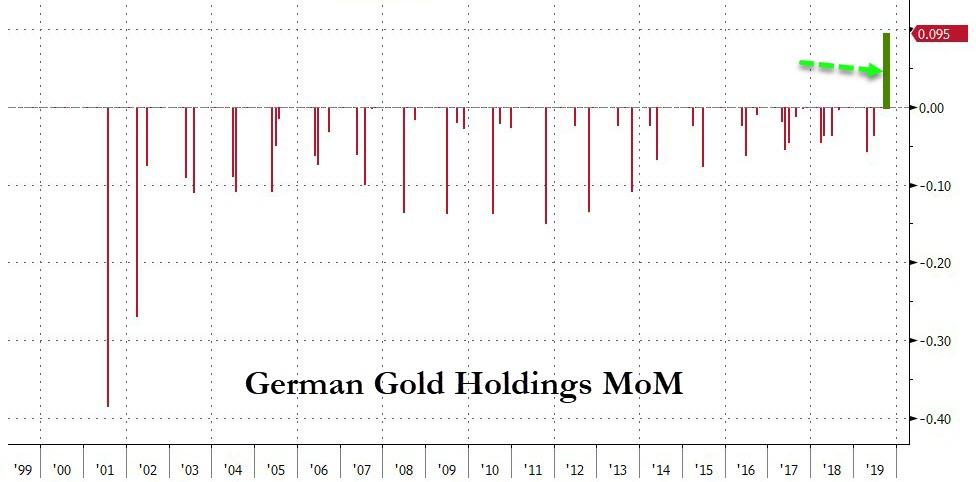
With the Fed’s money printing going into overdrive at the rate of some $60 billion a month, it’s no wonder that Central Banks around the world have been accumulating gold at a record pace. Today, we learned that my home country, Germany, has joined the party by openly buying gold into its reserve holdings—for the first time in 21 years.
That is not surprising, as Germany has more experience with the awful effects of too much money printing than any other industrialized nation. If you are not familiar with that part of history, please read more about the Weimar Republic.
Combining the ECB policies along with Deutsche Bank’s (one of the largest derivatives holders in the world) precipitous demise, fears of a looming financial crises have become a possibility for the Germans and have subsequently caused this renewed interest in gold.
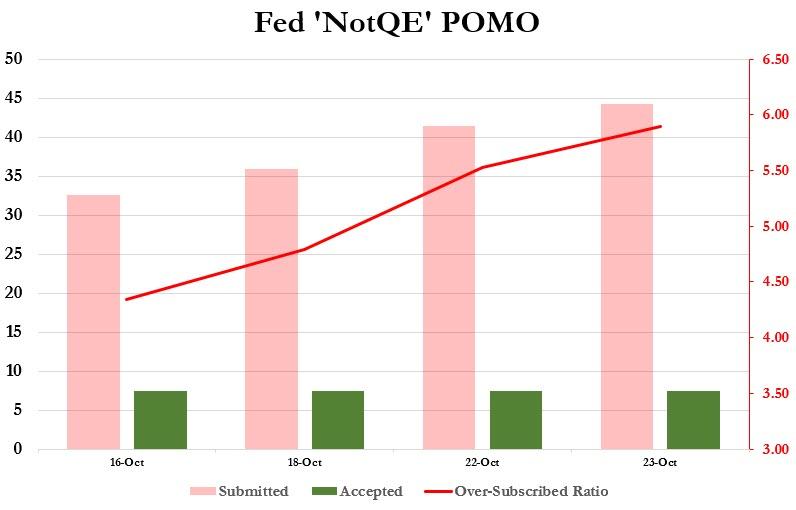
Here in the US, the liquidity scramble in the overnight repo market continues, as the latest operation was oversubscribed 5.9 times. As ZH pointed out, it simply means that the demand for the Fed’s permanent liquidity injection is increasing with every operation.
How long can that go on before we go exponential? And just as important, how long can this go on before equity markets realize that not all is well with the financial plumbing?
Be that as it may, at least for today, the major indexes moved aimlessly and looked to end up at their respective unchanged lines when a last-minute pump assured a green close.
2. ETFs in the Spotlight
In case you missed the announcement and description of this section, you can read it here again.
It features 10 broadly diversified and sector ETFs from my HighVolume list as posted every Saturday. Furthermore, they are screened for the lowest MaxDD% number meaning they have been showing better resistance to temporary sell offs than all others over the past year.
The below table simply demonstrates the magnitude with which some of the ETFs are fluctuating regarding their positions above or below their respective individual trend lines (%+/-M/A). A break below, represented by a negative number, shows weakness, while a break above, represented by a positive percentage, shows strength.
For hundreds of ETF choices, be sure to reference Thursday’s StatSheet.
For this current domestic “Buy” cycle, here’s how some our candidates have fared:
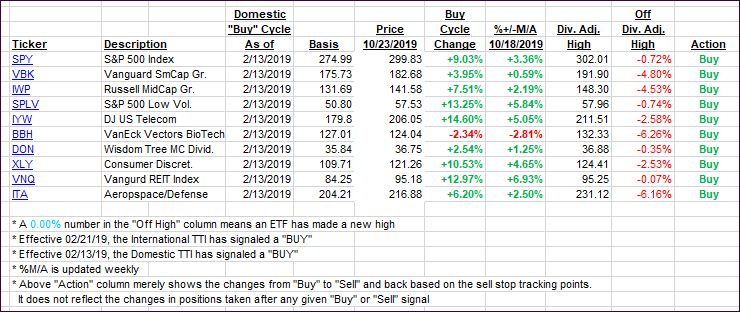
Again, the %+/-M/A column above shows the position of the various ETFs in relation to their respective long-term trend lines, while the trailing sell stops are being tracked in the “Off High” column. The “Action” column will signal a “Sell” once the -8% point has been taken out in the “Off High” column. For more volatile sector ETFs, the trigger point is -10%.
3. Trend Tracking Indexes (TTIs)
Our Trend Tracking Indexes (TTIs) inched up, as only a last-minute market bounce created a positive close.
Here’s how we closed 10/23/2019:
Domestic TTI: +3.88% above its M/A (prior close +3.58%)—Buy signal effective 02/13/2019
International TTI: +1.90% above its M/A (prior close +1.63%)—Sell signal effective 10/03/2019
Disclosure: I am obliged to inform you that I, as well as my advisory clients, own some of the ETFs listed in the above table. Furthermore, they do not represent a specific investment recommendation for you, they merely show which ETFs from the universe I track are falling within the specified guidelines.
Contact Ulli