ETF Tracker StatSheet
You can view the latest version here.
ENDING ON A WEAK NOTE

- Moving the markets
An early upturn hit the skids after a report that a Chinese delegation had canceled plans to visit farms in Montana, as part of negotiations designed to sell more farming products. Helping the positive tone early on was news that Trump was exempting hundreds of Chinese products from tariffs.
Things fell apart when it became known that Trump wanted a “complete” deal and not just a temporary agreement to promote U.S. agricultural goods. The trade mood went from bad to worse when he then added that he “does not need a China deal before the election,” causing the Trade Deal odds to tumble.
Even the Fed, with its current battle to control the greatest liquidity crisis in overnight repos in over a decade, seems to be confused, as two of its talking heads offered opposing opinions, according to ZH:
- Bullard: Recession straight ahead!
- Rosengren: Bubbles ready to burst!
So, which is it?
That kind of split within the Fed makes me realize that there are no certainties in the current market environment. That’s why it remains to be of great importance to have an exit strategy in place, so we don’t get caught on the wrong side, should things fall apart.
For the week, the major indexes slipped and so did bond yields, which came off their recent highs with the 10-year dropping from 1.9% to 1.73%, as this chart shows.
We’ll have to wait and see if this softening of bond yields is a sign of more to come, which should help equities to move out of this week’s doldrums.
On the other hand, the Fed’s emergency liquidity measures in the overnight lending market, if not resolved satisfactorily, could extract a pound of flesh from equities when trading resumes next week.
2. ETFs in the Spotlight
In case you missed the announcement and description of this section, you can read it here again.
It features 10 broadly diversified and sector ETFs from my HighVolume list as posted every Saturday. Furthermore, they are screened for the lowest MaxDD% number meaning they have been showing better resistance to temporary sell offs than all others over the past year.
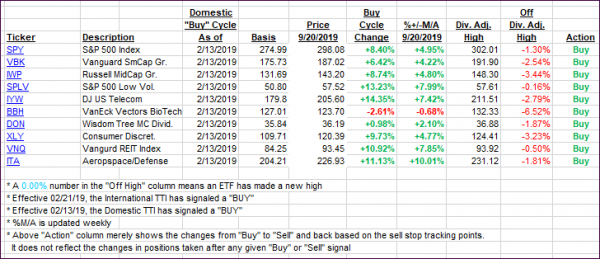
The below table simply demonstrates the magnitude with which some of the ETFs are fluctuating regarding their positions above or below their respective individual trend lines (%+/-M/A). A break below, represented by a negative number, shows weakness, while a break above, represented by a positive percentage, shows strength.
For hundreds of ETF choices, be sure to reference Thursday’s StatSheet.
For this current domestic “Buy” cycle, here’s how some our candidates have fared:

Again, the %+/-M/A column above shows the position of the various ETFs in relation to their respective long-term trend lines, while the trailing sell stops are being tracked in the “Off High” column. The “Action” column will signal a “Sell” once the -8% point has been taken out in the “Off High” column. For more volatile sector ETFs, the trigger point is -10%.
3. Trend Tracking Indexes (TTIs)
Our Trend Tracking Indexes (TTIs) retreated, as the major indexes lost steam this week.
Here’s how we closed 09/20/2019:
Domestic TTI: +4.71% above its M/A (prior close +5.74%)—Buy signal effective 02/13/2019
International TTI: +2.47% above its M/A (prior close +2.86%)—Buy signal effective 09/12/2019
Disclosure: I am obliged to inform you that I, as well as my advisory clients, own some of the ETFs listed in the above table. Furthermore, they do not represent a specific investment recommendation for you, they merely show which ETFs from the universe I track are falling within the specified guidelines.
———————————————————-
WOULD YOU LIKE TO HAVE YOUR INVESTMENTS PROFESSIONALLY MANAGED?
Do you have the time to follow our investment plans yourself? If you are a busy professional who would like to have his portfolio managed using our methodology, please contact me directly or get more details here.
———————————————————
Back issues of the ETF Tracker are available on the web.
Contact Ulli