ETF Tracker StatSheet
You can view the latest version here.
BANKING ON A FED RATE CUT

- Moving the markets
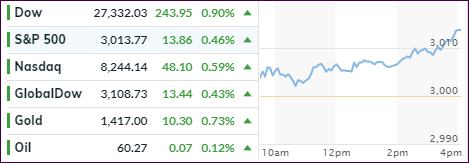
Yesterday’s rally continued this morning and accelerated throughout the session, as traders were now convinced that a rate cut by the Fed is a sure thing, so front running was the name of the game.
Since Fed chair Powell’s 2-day congressional testimony did not include any negatives, but rather words like the U.S. economy is in a “very good place,” traders felt invigorated that a cut was coming, so the bullish theme continued.
Even a stronger-than-expected U.S. inflation print in core producer prices could not put a dent in current enthusiasm, with further support coming from hopes the global economy will slow even more, forcing the Fed’s hand for a possible 0.5% reduction in rates.
One analyst summed it up like this:
This is one of those mornings where bad news is good news for stocks, while good news is bad news for bonds… or in other words, any news is good for stocks.
The bullish view did not carry through all investment arenas. Chinese, European and Small Caps all lost for the week. Bond yields suffered, especially in Germany where the 10-year spiked the most since the middle of 2017, as prices collapsed.
Same here in the U.S. with specifically the 30-year yield jumping to 7-week highs, as the dollar corrected back down after its surge following the payroll announcement.
Things appear very uncertain and confusing, when looking at the big picture, which led BofA to release the following statement:
“…we anticipate an “overshoot” in credit & equity prices in coming months, followed by an overshoot in gold (US$ devaluation) before big H2 top in asset prices (as bond bubble pops & policy impotence visible).”
That prompted ZeroHedge to update this chart, which suggests that a picture is worth a thousand words.
2. ETFs in the Spotlight
In case you missed the announcement and description of this section, you can read it here again.
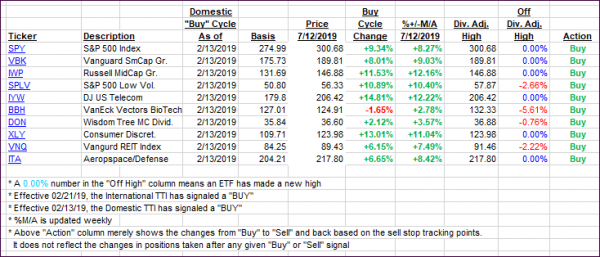
It features 10 broadly diversified and sector ETFs from my HighVolume list as posted every Saturday. Furthermore, they are screened for the lowest MaxDD% number meaning they have been showing better resistance to temporary sell offs than all others over the past year.
The below table simply demonstrates the magnitude with which some of the ETFs are fluctuating regarding their positions above or below their respective individual trend lines (%+/-M/A). A break below, represented by a negative number, shows weakness, while a break above, represented by a positive percentage, shows strength.
For hundreds of ETF choices, be sure to reference Thursday’s StatSheet.
For this current domestic “Buy” cycle, here’s how some our candidates have fared:

Again, the %+/-M/A column above shows the position of the various ETFs in relation to their respective long-term trend lines, while the trailing sell stops are being tracked in the “Off High” column. The “Action” column will signal a “Sell” once the -8% point has been taken out in the “Off High” column. For more volatile sector ETFs, the trigger point is -10%.
3. Trend Tracking Indexes (TTIs)
Our Trend Tracking Indexes (TTIs) extended their upward climb with both of them now deeply entrenched on the bullish side of their respective trend lines.
Here’s how we closed 07/12/2019:
Domestic TTI: +8.22% above its M/A (last close +7.78%)—Buy signal effective 02/13/2019
International TTI: +5.12% above its M/A (last close +4.80%)—Buy signal effective 06/19/2019
Disclosure: I am obliged to inform you that I, as well as my advisory clients, own some of
the ETFs listed in the above table. Furthermore, they do not represent a specific investment
recommendation for you, they merely show which ETFs from the universe I track are falling within the specified guidelines.
———————————————————-
WOULD YOU LIKE TO HAVE YOUR INVESTMENTS PROFESSIONALLY MANAGED?
Do you have the time to follow our investment plans yourself? If you are a busy professional who would like to have his portfolio managed using our methodology, please contact me directly or get more details here.
———————————————————
Back issues of the ETF Tracker are available on the web.
Contact Ulli