ETF Tracker StatSheet
ENDING THE WORST WEEK OF 2019 ON A POSITIVE NOTE

- Moving the markets
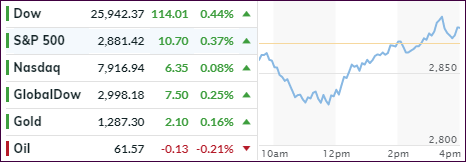
Again, stocks opened to the downside and slid sharply lower during the early going with the Dow sinking some 300 points at its low. The culprit was the fact that the higher China tariffs went into effect today causing traders more anxiety, as hope for a last-minute settlement vanished.
Things looked pretty dicey with all major indexes ‘losing’ their 50-day M/As, while the S&P 500 broke below the week’s lows.
Apparently, the powers to be did not like how this day was shaping up, so Trump stepped up the plate by tweeting soothing comments like “talks were proceeding in a very congenial manner,” and “there was no need to rush.” This was followed by Mnuchin muttering “constructive” and other words designed to put some lipstick on that trade pig.
That was sufficient to turn sentiment around, and the 4th biggest buy program of the month, maybe it was interference by the Plunge Protection Team, got activated and bearish momentum was replaced by an all-out bullish attack, which not only wiped out all the day’s losses but pushed the major indexes to a green close.
As ZH posted, this is the 7th Friday in a row where a sudden buy panic lifted stocks out of trouble. Still for the week, the major indexes ended down with the S&P giving back some 2.21%.
I am sure, we have not seen the end of this trade movie, which most likely will continue with full force next week. So far, the wild swings have not affected our positions, however, the International TTI (section 3) has moved closer to a potential ‘Sell’ signal, but we will have to wait and see if it materializes.
2. ETFs in the Spotlight
In case you missed the announcement and description of this section, you can read it here again.
It features 10 broadly diversified and sector ETFs from my HighVolume list as posted every Saturday. Furthermore, they are screened for the lowest MaxDD% number meaning they have been showing better resistance to temporary sell offs than all others over the past year.
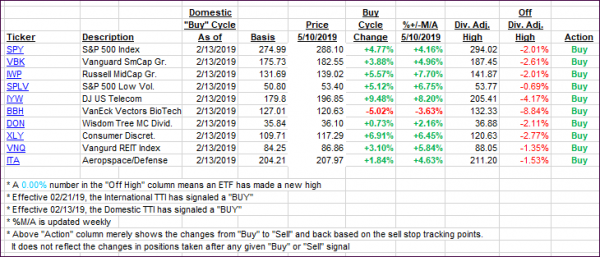
The below table simply demonstrates the magnitude with which some of the ETFs are fluctuating regarding their positions above or below their respective individual trend lines (%+/-M/A). A break below, represented by a negative number, shows weakness, while a break above, represented by a positive percentage, shows strength.
For hundreds of ETF choices, be sure to reference Thursday’s StatSheet.
For this current domestic “Buy” cycle, here’s how some our candidates have fared:

Again, the %+/-M/A column above shows the position of the various ETFs in relation to their respective long-term trend lines, while the trailing sell stops are being tracked in the “Off High” column. The “Action” column will signal a “Sell” once the -8% point has been taken out in the “Off High” column. For more volatile sector ETFs, the trigger point is -10%.
3. Trend Tracking Indexes (TTIs)
Our Trend Tracking Indexes (TTIs) finally managed to head north after some relentless selling this week.
Here’s how we closed 05/10/2019:
Domestic TTI: +4.43% above its M/A (last close +4.05%)—Buy signal effective 02/13/2019
International TTI: +1.02% above its M/A (last close +0.68%)—Buy signal effective 02/21/2019
Disclosure: I am obliged to inform you that I, as well as my advisory clients, own some of the ETFs listed in the above table. Furthermore, they do not represent a specific investment recommendation for you, they merely show which ETFs from the universe I track are falling within the specified guidelines.
———————————————————-
WOULD YOU LIKE TO HAVE YOUR INVESTMENTS PROFESSIONALLY MANAGED?
Do you have the time to follow our investment plans yourself? If you are a busy professional who would like to have his portfolio managed using our methodology, please contact me directly or get more details at:
———————————————————
Back issues of the ETF/No Load Fund Tracker are available on the web at:
