- Moving the markets
Last Monday, I wrote how the direction of bond yields affects the performance of low volatility ETFs, such as SPLV, compared to the underlying index. Here’s what I said:
Case in point is the S&P 500, represented by SPY, which managed to eke out a gain of +0.10% during today’s session. It’s conservative cousin, namely SPLV, gave back -0.39% due to the spike in bond yields. Once that scenario reverses, and the markets correct, you will see the exact opposite, as SPLV will hold up better than SPY.
This is exactly what happened today, as the 10-year bond yield stumbled and dropped 5 basis points. SPY lost -0.23% while the SPLV gained +0.36%. You just need to be aware of that relationship to better evaluate which one would be an appropriate selection for your portfolio.
Throughout the day, the major indexes struggled for direction and closed slightly in the red. Traders tried to digest not only yesterday’s gains but also wrestled with the question “what’s next,” after the S&P 500 and Nasdaq made new all-time highs.
Not helping upward momentum were not so great earnings from heavyweights such as Boeing and Caterpillar, which suggested that the health of corporate America may be mixed at best. Earnings will remain in focus with more than 20% of the S&P’s constituents having presented their quarterly report card.
Nearly 80% of those have produced better than expected results, but estimates had been previously lowered due to recessionary worries, so “beating” them is of questionable value.
I like looking at the big picture via graphs that demonstrate the decoupling of indexes that should be in sync. This chart clearly shows that the S&P 500 is in lofty territory, while bond yields have dropped and are showing a different picture. A re-coupling will have to occur sooner or later, the direction of which is the big unknown.
- ETFs in the Spotlight
In case you missed the announcement and description of this section, you can read it here again.
It features 10 broadly diversified and sector ETFs from my HighVolume list as posted every Saturday. Furthermore, they are screened for the lowest MaxDD% number meaning they have been showing better resistance to temporary sell offs than all others over the past year.
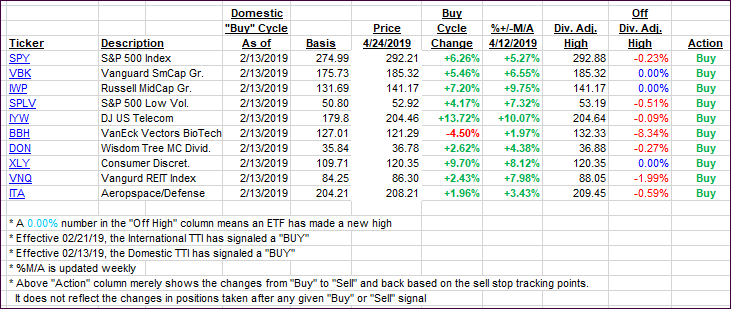
The below table simply demonstrates the magnitude with which some of the ETFs are fluctuating regarding their positions above or below their respective individual trend lines (%+/-M/A). A break below, represented by a negative number, shows weakness, while a break above, represented by a positive percentage, shows strength.
For hundreds of ETF choices, be sure to reference Thursday’s StatSheet.
For this current domestic “Buy” cycle, here’s how some our candidates have fared:
Again, the %+/-M/A column above shows the position of the various ETFs in relation to their respective long-term trend lines, while the trailing sell stops are being tracked in the “Off High” column. The “Action” column will signal a “Sell” once the -8% point has been taken out in the “Off High” column. For more volatile sector ETFs, the trigger point is -10%.
- Trend Tracking Indexes (TTIs)
Our Trend Tracking Indexes (TTIs) were mixed with the Domestic one inching up, while the International one dropped.
Here’s how we closed 04/24/2019:
Domestic TTI: +6.55% above its M/A (last close +6.58%)—Buy signal effective 02/13/2019
International TTI: +3.83% above its M/A (last close +4.46%)—Buy signal effective 02/21/2019
Disclosure: I am obliged to inform you that I, as well as my advisory clients, own some of the ETFs listed in the above table. Furthermore, they do not represent a specific investment recommendation for you, they merely show which ETFs from the universe I track are falling within the specified guidelines.
Contact Ulli

