ETF Tracker StatSheet
ENDING THE QUARTER ON A POSITIVE NOTE
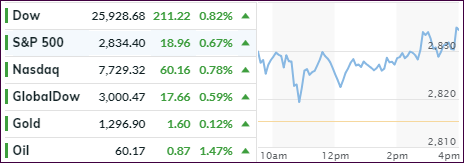
[Chart courtesy of MarketWatch.com]- Moving the markets
Continued optimism about more progress with the U.S.-China trade talks moved to front and center thereby pushing concerns over slowing global economies to the sidelines, at least for the time being.
Supporting the early rally was the market debut of Uber competitor LYFT, whose shares ended up trading at a market premium of 20% of what they were priced Thursday evening.
This bullish mood accelerated throughout the day with the major indexes picking up steam and closing at the highs of the day.
While the S&P 500 recorded its strongest quarter in a decade (+13.3%), let’s not forget that this comes after a devastating Q4 2018 performance of -13.5%, during which the Fed suddenly changed course by softening their interest rate policy thereby bailing out the Buy-and-Hold crowd and likely saving investors’ portfolios from far more serious destruction.
Ironically, all this occurred in the face of plunging bond yields and a surge in global money supply, while fundamental data, as represented by the Macro Surprise Index, simply tumbled.
But today, we also heard some positive econ reports during which we learned that consumer confidence rebounded and improved for the second straight month. At the same time, the pummeled real estate sector showed signs of life, as new home sales surged thanks to tumbling mortgage rates.
Earnings season will be on deck starting next week and will likely give us a better view not only if bullish forces are alive and well, but also if the markets have enough starch to weather out disappointments, which are sure to be part of the story line.
- ETFs in the Spotlight
In case you missed the announcement and description of this section, you can read it here again.
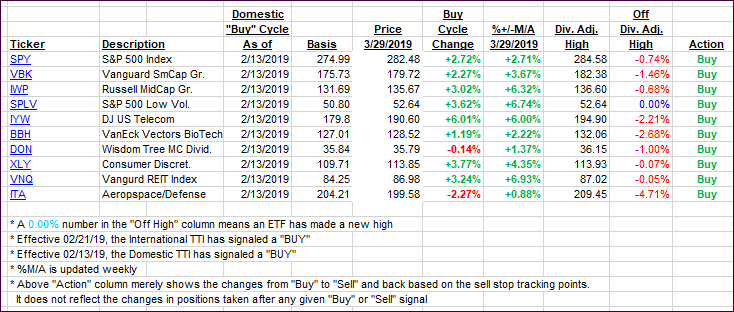
It features 10 broadly diversified and sector ETFs from my HighVolume list as posted every Saturday. Furthermore, they are screened for the lowest MaxDD% number meaning they have been showing better resistance to temporary sell offs than all others over the past year.
The below table simply demonstrates the magnitude with which some of the ETFs are fluctuating regarding their positions above or below their respective individual trend lines (%+/-M/A). A break below, represented by a negative number, shows weakness, while a break above, represented by a positive percentage, shows strength.
For hundreds of ETF choices, be sure to reference Thursday’s StatSheet.
For this current domestic “Buy” cycle, here’s how some our candidates have fared:
Again, the %+/-M/A column above shows the position of the various ETFs in relation to their respective long-term trend lines, while the trailing sell stops are being tracked in the “Off High” column. The “Action” column will signal a “Sell” once the -8% point has been taken out in the “Off High” column. For more volatile sector ETFs, the trigger point is -10%.
- Trend Tracking Indexes (TTIs)
Our Trend Tracking Indexes (TTIs) both headed north, as the bulls clearly had the upper hand.
Here’s how we closed 03/29/2019:
Domestic TTI: +3.60% above its M/A (last close +3.07%)—Buy signal effective 02/13/2019
International TTI: +1.23% above its M/A (last close +0.62%)—Buy signal effective 02/21/2019
Disclosure: I am obliged to inform you that I, as well as my advisory clients, own some of the ETFs listed in the above table. Furthermore, they do not represent a specific investment recommendation for you, they merely show which ETFs from the universe I track are falling within the specified guidelines.
———————————————————-
WOULD YOU LIKE TO HAVE YOUR INVESTMENTS PROFESSIONALLY MANAGED?
Do you have the time to follow our investment plans yourself? If you are a busy professional who would like to have his portfolio managed using our methodology, please contact me directly or get more details at:
https://theetfbully.com/personal-investment-management/
———————————————————
Back issues of the ETF/No Load Fund Tracker are available on the web at:
https://theetfbully.com/newsletter-archives/
Contact Ulli

