ETF Tracker StatSheet
U.S.-CHINA TRADE EUPHORIA POWERS MARKETS
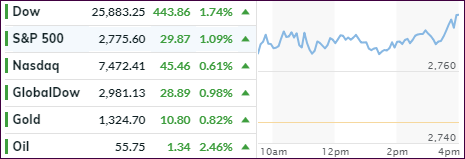
[Chart courtesy of MarketWatch.com]- Moving the markets
Hope and euphoria, that progress between the U.S. and China trade negotiators will continue, combined forces to drive the major indexes further into lofty territory.
Fundamentals don’t seem to matter, and the potentially soft GDP number, in part caused by a collapse in retail sales, appears to be just an afterthought. Even the US Macro Surprise index did its best imitation of a swan dive thereby disconnecting from current market levels.
All that mattered today was expectations for further talks appear real, despite the warring parties being far apart on key trade issues. Nevertheless, negotiations concluded today and are set to resume next week in Washington, which was interpreted as a sign that both sides are eager to reach a settlement prior to the March 1 deadline.
Helping matters were reports from the White House describing the talks as “detailed and intensive” and “progress between the two parties.” Even Trump’s declaration of a national emergency could not stop the computer algos’ relentless market push higher with an extra shove into the close.
For sure, it’s been a roller coaster ride. After the S&P 500 having shown its worst quarter (Q4 2018) in many decades, it now has stormed back to notch its best start to a year since 1991.
It reached this week what I call the break-even point. This simply means that, since our domestic ‘Sell’ signal on 11/15/18, it arrived at the point in time where those buy-and-hold investors made up all their losses from last quarter. So, for us trend trackers, nothing was lost, and nothing was gained.
Today’s gains propelled out International TTI above its long-term trend line and into bullish territory. Here too, I will wait a few days to see if this level holds before issuing a ‘Buy’ for that sector.
- ETFs in the Spotlight
In case you missed the announcement and description of this section, you can read it here again.
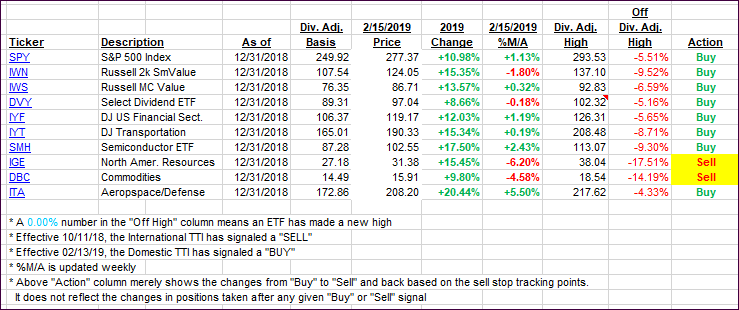
It features 10 broadly diversified and sector ETFs from my HighVolume list as posted every Saturday. Furthermore, they are screened for the lowest MaxDD% number meaning they have been showing better resistance to temporary sell offs than all others over the past year.
The below table simply demonstrates the magnitude with which some of the ETFs are fluctuating regarding their positions above or below their respective individual trend lines (%M/A). A break below, represented by a negative number, shows weakness, while a break above, represented by a positive percentage, shows strength.
For hundreds of ETF choices, be sure to reference Thursday’s StatSheet.
Year to date, here’s how our original candidates from the prior ‘Buy’ cycle have fared:
Again, the %M/A column above shows the position of the various ETFs in relation to their respective long-term trend lines, while the trailing sell stops are being tracked in the “Off High” column. The “Action” column will signal a “Sell” once the -8% point has been taken out in the “Off High” column. For more volatile sector ETFs, the trigger point is -10%.
- Trend Tracking Indexes (TTIs)
Our Trend Tracking Indexes (TTIs) rocketed higher with the International one breaking its trend line to the upside. Here to, I will wait a few days to see if this move has staying power before issuing a new ‘Buy’ for that area.
Here’s how we closed 02/15/2019:
Domestic TTI: +2.88% above its M/A (last close +1.83%)—Buy signal effective 02/13/2019
International TTI: +0.40% above its M/A (last close -0.57%)—Sell signal effective 10/11/2018
Disclosure: I am obliged to inform you that I, as well as my advisory clients, own some of the ETFs listed in the above table. Furthermore, they do not represent a specific investment recommendation for you, they merely show which ETFs from the universe I track are falling.
———————————————————-
WOULD YOU LIKE TO HAVE YOUR INVESTMENTS PROFESSIONALLY MANAGED?
Do you have the time to follow our investment plans yourself? If you are a busy professional who would like to have his portfolio managed using our methodology, please contact me directly or get more details at:
https://theetfbully.com/personal-investment-management/
———————————————————
Back issues of the ETF/No Load Fund Tracker are available on the web at:
https://theetfbully.com/newsletter-archives/
Contact Ulli


Comments 2
Hey, Ulli
I noticed that you didn’t include my last post. I don’t mean to come across as snarky.
I noted in today’s post the passage, “…for us trend trackers, nothing was lost, and nothing was gained.” As you (probably) know, I’m a Buy and Hold investor. I stayed in, as is my wont. Your statement about nothing lost is accurate for me, as I did not sell anything, hence, did not create a taxable event. For those who fled to cash on 11/15/18 will receive a call from the Tax Man. Nothing lost?
Smokey
2/15/19
Author
Sure, for those with taxable accounts, the tax man will call. Most of my clients, however, have retirement accounts, so there will will no consequences.
On the other hand, if this had been a drop of say 50%, which will happen at some point, I argue that it’s far better to avoid portfolio disaster than worry about the taxes. Right now, you can thank the Fed for its policy U-turn. Next time, when bubble goes into burst mode, you may not be that lucky…