- Moving the markets
The opening dump to start the 1st trading day of 2019, with the Dow dropping almost 400 points, had investors on edge, until a slow climb pulled the major indexes out of the doldrums. Things looked shaky as market direction was predominantly sideways but, in the end, we closed in the green by a small margin.
Hurting the markets early on were worries about global growth, or rather lack thereof, especially in China, where manufacturing data showed a severe drop by tumbling to the weakest level since February 2016. Bullish support for equities arrived from the energy sector, as oil suddenly spiked over 2% (did an algo go wild?), but with that commodity being extremely volatile anyway, one should not read too much into that.
We saw dismal PMI data not only here in the US but also in Europe and China, which was negative for market sentiment, so a huge short squeeze was the second element that helped make this first trading day of the New Year one that ended up on the plus side of the unchanged line.
We saw chaos in the bond market with yields tumbling to 11-month lows, as the 10-year hit 2.60%, its lowest since last January as, despite a rate-hiking Fed, the global growth scare is weighing heavy on investors’ minds and crushing yields in the process.
The widely followed yield curve is now inverted from year 1 through year 8, meaning that short-term yields are higher than longer term ones, a condition that has always preceded a recession. Remember, bond investors are considered the smart money, which makes you wonder if equities must come down, as shown in this chart, to sync up with bond yields.
- ETFs in the Spotlight
In case you missed the announcement and description of this section, you can read it here again.
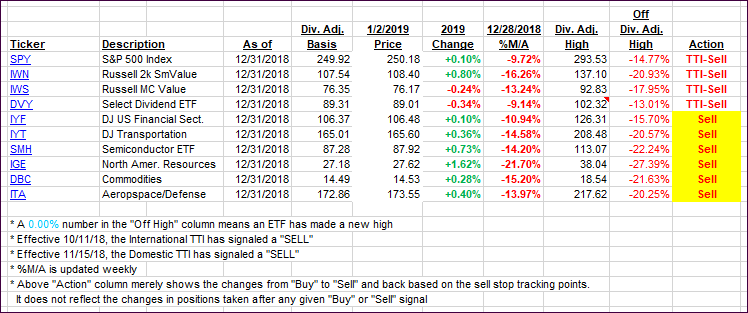
It features 10 broadly diversified and sector ETFs from my HighVolume list as posted every Saturday. Furthermore, they are screened for the lowest MaxDD% number meaning they have been showing better resistance to temporary sell offs than all others over the past year.
The below table simply demonstrates the magnitude with which some of the ETFs are fluctuating regarding their positions above or below their respective individual trend lines (%M/A). A break below, represented by a negative number, shows weakness, while a break above, represented by a positive percentage, shows strength.
For hundreds of ETF choices, be sure to reference Thursday’s StatSheet.
Year to date, here’s how our original candidates from the last cycle have fared:
Again, the %M/A column above shows the position of the various ETFs in relation to their respective long-term trend lines, while the trailing sell stops are being tracked in the “Off High” column. The “Action” column will signal a “Sell” once the -8% point has been taken out in the “Off High” column. For more volatile sector ETFs, the trigger point is -10%.
- Trend Tracking Indexes (TTIs)
Our Trend Tracking Indexes (TTIs) were mixed and hardly changed due to the markets seesawing sideways.
Here’s how we closed 01/02/2019:
Domestic TTI: -9.39% below its M/A (last close -9.44%)—Sell signal effective 11/15/2018
International TTI: -8.98% below its M/A (last close -8.75%)—Sell signal effective 10/11/2018
Disclosure: I am obliged to inform you that I, as well as my advisory clients, own some of the ETFs listed in the above table. Furthermore, they do not represent a specific investment recommendation for you, they merely show which ETFs from the universe I track are falling.
Contact Ulli


Comments 2
Hey, Ulli
Reading your newsletter today left me a bit confused. You state, “…dismal PMI data not only here in the US but also in Europe and China, which was negative for market sentiment, so a huge short squeeze…helped make this first trading day of the New Year one that ended up on the plus side of the unchanged line.”
Hhhmmm…wouldn’t “dismal PMI data” normally result in a positive for the Shorts?
Smokey
1/2/19
Author
Yes, you are correct, but that did not happen. Market manipulation? You’ll be the judge?
Ulli…