- Moving the markets
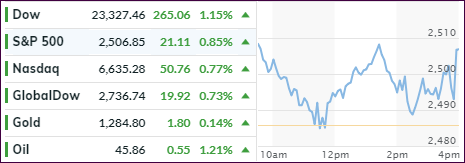
Despite last week’s rebound and today’s green close, it simply wasn’t enough to wipe out the losses of a miserable year and an even worse December. While for 2018 the S&P 500 “only” fell -6.2%, its biggest yearly tumble in a decade, this month left a bitter aftertaste with the index dropping -9.2%, as bearish forces remained dominant.
Individual stocks fared far worse with Dow component Goldman Sachs, for example, being down some 35% YTD, however, all systemically important banks collapsed, despite reassurances of “fortress” like balance sheets. Bear markets simply don’t discriminate, which means that in 2018 no corner of the world escaped unscathed.
On Wednesday, Wall Street will be again fully staffed with traders eager to make buy/sell decisions. Sure, optimistic trade news with China could give the current rally more support, but for how long?
To me, the unanswered question, that will have the biggest market impact, is this one: If the Fed reverses its widely “blamed” policy error (hiking rates), will this result in further market declines due to total loss of confidence or form the basis for a new bull market?
Only time will tell.
Happy New Year!
- ETFs in the Spotlight
In case you missed the announcement and description of this section, you can read it here again.
It features 10 broadly diversified and sector ETFs from my HighVolume list as posted every Saturday. Furthermore, they are screened for the lowest MaxDD% number meaning they have been showing better resistance to temporary sell offs than all others over the past year.
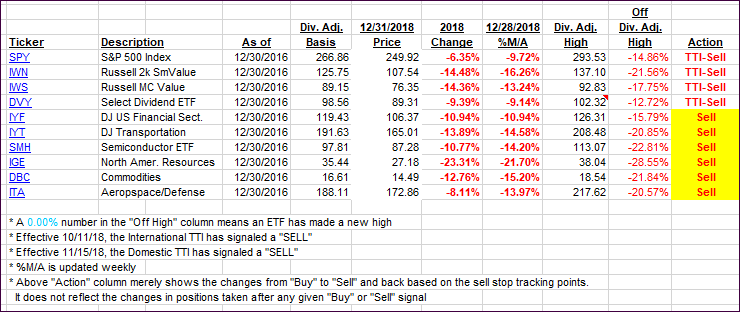
The below table simply demonstrates the magnitude with which some of the ETFs are fluctuating regarding their positions above or below their respective individual trend lines (%M/A). A break below, represented by a negative number, shows weakness, while a break above, represented by a positive percentage, shows strength.
For hundreds of ETF choices, be sure to reference Thursday’s StatSheet.
Year to date, here’s how our original candidates have fared:
Again, the %M/A column above shows the position of the various ETFs in relation to their respective long-term trend lines, while the trailing sell stops are being tracked in the “Off High” column. The “Action” column will signal a “Sell” once the -8% point has been taken out in the “Off High” column. For more volatile sector ETFs, the trigger point is -10%.
- Trend Tracking Indexes (TTIs)
Our Trend Tracking Indexes (TTIs) improved, as the bulls managed a green close on the last day of the year.
Here’s how we closed 12/31/2018:
Domestic TTI: -9.44% below its M/A (last close -10.17%)—Sell signal effective 11/15/2018
International TTI: -8.75% below its M/A (last close -9.37%)—Sell signal effective 10/11/2018
Disclosure: I am obliged to inform you that I, as well as my advisory clients, own some of the ETFs listed in the above table. Furthermore, they do not represent a specific investment recommendation for you, they merely show which ETFs from the universe I track are falling.
Contact Ulli

