ETF Tracker StatSheet
MARKETS END A MISERABLE WEEK IN A SEA OF RED
[Chart courtesy of MarketWatch.com]- Moving the markets
Here we go again. An early bounce ran into resistance, as bears upheld their dominance and sent the major indexes into a tailspin with the Dow registering another 400-point loss leaving some traders stunned and speechless. That’s no surprise to me, as most participants haven’t been around long enough to know what causes bear markets, how to identify one and how to stay out of harms way.
It was an ugly week with the Dow and S&P 500 down around -7% (yes, that is for the week!) while the Nasdaq (and SmallCaps) tumbled a more dramatic -8.4%. The tech index has now officially slipped into a bear market, which is defined as a drop of at least 20% from its recent high.
ZH adds that this was the worst week for the Dow and Nasdaq since October 2008 and the worst week for the S&P 500 since August 2011. All three indexes have now closed lower the last 5 out of 6 weeks:
From the 52-week highs:
- Dow -16%
- S&P -17%
- Nasdaq 100 -21% – BEAR
- Nasdaq Composite -22% – BEAR
- Trannies -23.6% – BEAR
- Small Caps -26% – BEAR
The culprits taking the starch out of the early rebound were the same with fears of a partial government shutdown, slowing global growth and rising interest rates taking top billing.
Then Fed governor Williams came out to try to jawbone the markets higher, which worked for a while until his comment “the balance sheet runoff is on auto-pilot,” reversed the modest rally.
Not to be outdone, Trump’s trade advisor Peter Navarro chimed in that a “trade pact with China within 90 days may prove to be difficult.” That appeared to be the final nail in the bullish coffin and down we went. This graph depicts precisely the market reaction to Williams and Navarro.
At this time it seems that the Smart Money indicator is spot on meaning things could get really ugly from here. Sure, we’re bound to see a rebound with legs that holds short-term, but the major trend remains bearish until my TTIs prove otherwise.
As of today, the S&P 500 has tumbled -11.84% since the effective date of our Domestic “Sell” signal on 11/15/2018.
- ETFs in the Spotlight
In case you missed the announcement and description of this section, you can read it here again.
It features 10 broadly diversified and sector ETFs from my HighVolume list as posted every Saturday. Furthermore, they are screened for the lowest MaxDD% number meaning they have been showing better resistance to temporary sell offs than all others over the past year.
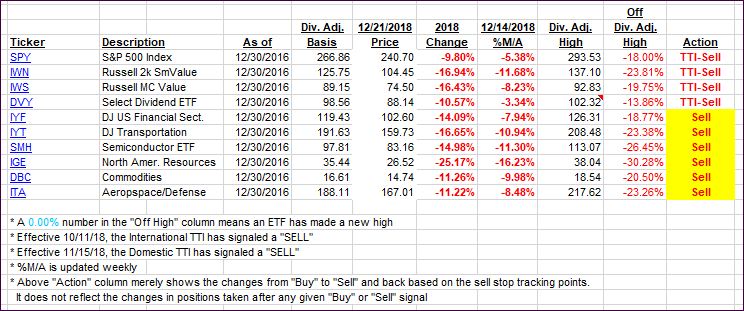
The below table simply demonstrates the magnitude with which some of the ETFs are fluctuating regarding their positions above or below their respective individual trend lines (%M/A). A break below, represented by a negative number, shows weakness, while a break above, represented by a positive percentage, shows strength.
For hundreds of ETF choices, be sure to reference Thursday’s StatSheet.
Year to date, here’s how our original candidates have fared:
Again, the %M/A column above shows the position of the various ETFs in relation to their respective long-term trend lines, while the trailing sell stops are being tracked in the “Off High” column. The “Action” column will signal a “Sell” once the -8% point has been taken out in the “Off High” column. For more volatile sector ETFs, the trigger point is -10%.
- Trend Tracking Indexes (TTIs)
Our Trend Tracking Indexes (TTIs) headed sharply south and are firmly established on the bearish side of their respective trend lines.
Here’s how we closed 12/21/2018:
Domestic TTI: -12.50% below its M/A (last close -11.08%)—Sell signal effective 11/15/2018
International TTI: -10.98% below its M/A (last close -10.01%)—Sell signal effective 10/11/2018
Disclosure: I am obliged to inform you that I, as well as my advisory clients, own some of the ETFs listed in the above table. Furthermore, they do not represent a specific investment recommendation for you, they merely show which ETFs from the universe I track are falling.
————————————————————-
READER Q & As
All Reader Q & A’s are listed at our web site!
Check it out at:
https://theetfbully.com/questions-answers/
———————————————————-
WOULD YOU LIKE TO HAVE YOUR INVESTMENTS PROFESSIONALLY MANAGED?
Do you have the time to follow our investment plans yourself? If you are a busy professional who would like to have his portfolio managed using our methodology, please contact me directly or get more details at:
https://theetfbully.com/personal-investment-management/
———————————————————
Back issues of the ETF/No Load Fund Tracker are available on the web at:
https://theetfbully.com/newsletter-archives/
Contact Ulli

