- Moving the Markets
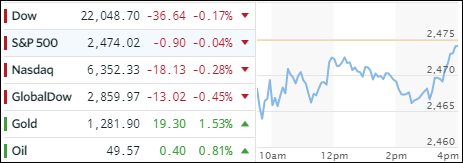
Yesterday’s slippage continued early this morning, but dip buyers stepped in encouraged by a NT Times story alleging that Trump’s ‘Fire and Fury’ words were his own and not US policy. During the last hour, the whipping boy of the year, AKA the VIX, was spanked again and while helping the indexes recover, they fell short of the intended goal, namely to cross back above the unchanged line.
With geopolitical uncertainty in full swing, it was no surprise to see gold rally solidly by adding +1.53%. In regards to equity ETFs, we saw mainly red numbers with SmallCaps (SCHA) surrendering -0.75%, closely followed by MidCaps (SCHM) with -0.53%. Even the Emerging Markets (SCHE) were unable to mount a rally and gave back -0.82%. Eking out a tiny gain were Dividend ETFs (SCHD) with +0.04%; Transportations (IYT) closed unchanged.
While FANG stocks continued their journey south, Apple scored a new record high and gained +0.61%. The VIX headed north again and broke above the 12 level, and above its 200-day M/A, which is quite a change from its recent all-time low just below 9. If this trend is sustained, equities will eventually be negatively affected. Bonds were the beneficiary of this uncertainty as yields dropped and the 30-year bond rallied to add +0.55%. The US dollar (UUP) was fairly docile, traded sideways and closed down -0.08%.
- ETFs in the Spotlight (updated for 2017)
In case you missed the announcement and description of this section, you can read it here again.
It features 10 broadly diversified and sector ETFs from my HighVolume list as posted every Saturday. Furthermore, they are screened for the lowest MaxDD% number meaning they have been showing better resistance to temporary sell offs than all others over the past year.
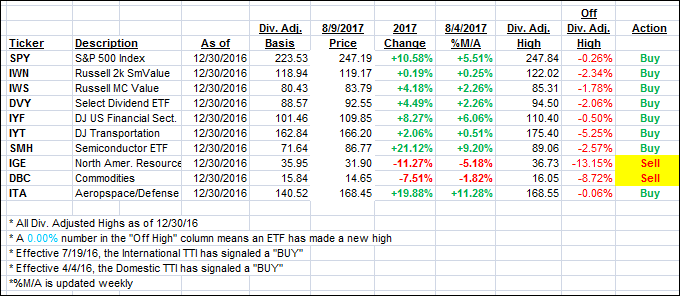
The below table simply demonstrates the magnitude with which some of the ETFs are fluctuating in regards to their positions above or below their respective individual trend lines (%M/A). A break below, represented by a negative number, shows weakness, while a break above, represented by a positive percentage, shows strength.
For hundreds of ETF choices, be sure to reference Thursday’s StatSheet.
Year to date, here’s how the 2017 candidates have fared so far:
Again, the %M/A column above shows the position of the various ETFs in relation to their respective long term trend lines, while the trailing sell stops are being tracked in the “Off High” column. The “Action” column will signal a “Sell” once the -7.5% point has been taken out in the “Off High” column.
- Trend Tracking Indexes (TTIs)
Our Trend Tracking Indexes (TTIs) again slipped as the trend was predominantly sideways.
Here’s how we closed 8/9/2017:
Domestic TTI: +3.03% (last close +3.09%)—Buy signal effective 4/4/2016
International TTI: +7.36% (last close +7.92%)—Buy signal effective 7/19/2016
Disclosure: I am obliged to inform you that I, as well as my advisory clients, own some of the ETFs listed in the above table. Furthermore, they do not represent a specific investment recommendation for you, they merely show which ETFs from the universe I track are falling within the guidelines specified.
Contact Ulli


Comments 4
Hey, Uli
Perhaps I didn’t properly articulate my question to you re manipulation of the market. Your response seems to address computerized trading, which is not an attempt to “manipulate” the market. It merely takes advantage in microseconds of changing market conditions. However, your continuing remarks alluding to some behind-the-scenes activities designed, e.g., to drive down the VIX, and “…ensure a green ending…” do not resonate with that situation.
Do you sincerely believe that some sinister force is directing this market?
Smokey
8/9/17
Smokey,
No, it’s not some sinister force, it’s the Central Banks (CBs)world wide that have engaged in propping up equities via direct purchases. Even smaller banks like the SNB (Swiss National Bank) owns now over $70 billion in US stocks. That’s just a drop in the bucket compared to the larger ones, like the ECB, the Fed and Japanese banks.
The rally of the of the past few years has not been based on fundamentals but on CB buying.
Ulli…
Bad day for the stock market. Hhhmmm…wonder why the Central Banks didn’t step in to stop the carnage.
Yes, they own a lot of US stocks, but that seems to me to have been a really good investment on their own behalf as vs “propping up the market.”.
Smokey
8/17/17
This was just a minor correction but, eventually, once selling really accelerates, propping up attempts may no longer work…