- Moving the Markets
Caterpillar and McDonalds combined to continue yesterday’s rally with Trump’s planned tax cut announcement, scheduled for tomorrow, providing the emotional fire power. The Nasdaq managed to conquer the 6,000 level and closed solidly above it in part due to gains by heavyweights Apple and Microsoft.
So far, overall profits of S&P companies are estimated to have risen 11.4% in the first quarter, which would be the most since 2011. However, the devil always is always in the details, although these days the only thing that matters is the headline number. Case in point is Caterpillar and its “tremendous earnings growth” which, when taking out adjustments and looking at real GAAP EPS, shows an entirely different picture as you can read here.
The last couple of days have been extremely painful for those professional investors (and amateurs) who had accumulated short positions. They were squeezed and most had to cover, meaning they had to buy offsetting long positions to cover their shorts, thereby contributing to the bullish theme of this week.
Short interest is measured and is considered the secret sauce that can extend a bull market’s life. However, the latest numbers showing short interest for the market’s most liquid ETF (S&P 500) having currently dropped to levels not seen since May 2007 just prior the S&P’s top and free fall. This begs the question as to how much ammunition will be left to have any effect on the next short squeeze, which will be needed to push equities higher.
- ETFs in the Spotlight (updated for 2017)
In case you missed the announcement and description of this section, you can read it here again.
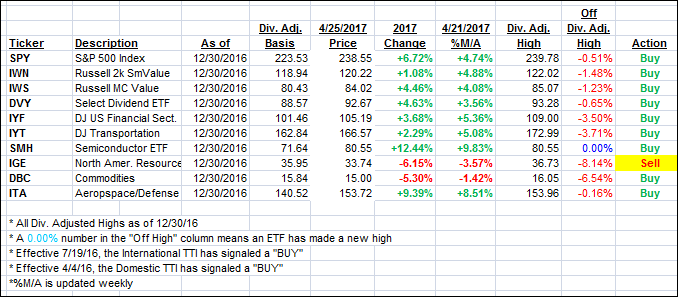
It features 10 broadly diversified and sector ETFs from my HighVolume list as posted every Saturday. Furthermore, they are screened for the lowest MaxDD% number meaning they have been showing better resistance to temporary sell offs than all others over the past year.
The below table simply demonstrates the magnitude with which some of the ETFs are fluctuating in regards to their positions above or below their respective individual trend lines (%M/A). A break below, represented by a negative number, shows weakness, while a break above, represented by a positive percentage, shows strength.
For hundreds of ETF choices, be sure to reference Thursday’s StatSheet.
Year to date, here’s how the 2017 candidates have fared so far:
Again, the %M/A column above shows the position of the various ETFs in relation to their respective long term trend lines, while the trailing sell stops are being tracked in the “Off High” column. The “Action” column will signal a “Sell” once the -7.5% point has been taken out in the “Off High” column.
- Trend Tracking Indexes (TTIs)
Our Trend Tracking Indexes (TTIs) moved higher as the bullish theme of the week continued.
Here’s how we closed 4/25/2017:
Domestic TTI: +3.15% (last close +2.92%)—Buy signal effective 4/4/2016
International TTI: +7.22% (last close +6.55%)—Buy signal effective 7/19/2016
Disclosure: I am obliged to inform you that I, as well as my advisory clients, own some of the ETFs listed in the above table. Furthermore, they do not represent a specific investment recommendation for you, they merely show which ETFs from the universe I track are falling within the guidelines specified.
Contact Ulli


Comments 2
Hang in there, Uli. All permabears will be right by and by.
Smokey,
Trying to be realistic. Predicting the imminent end of this mother of all financial manias is tiresome for both writers and readers, so let’s just assume it will end eventually, and that its demise will be spectacular.