
1. Moving the Markets
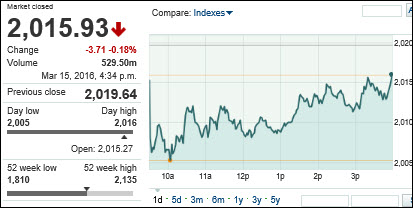
Stocks ended at par today as Wall Street reacted to a resumed slide in oil prices and braced for the Federal Reserve’s decision Wednesday on interest rates.
A major driver of the recent stock market rally has been a sharp rebound in oil prices. But U.S.-produced crude has reversed course the past two trading sessions and has resumed its fall amid fresh worries about oversupply, which has weighed on market sentiment. A barrel of West Texas Intermediate crude closed down 2.3%, to $36.45.
Investors were also digesting the decision of the Bank of Japan not to slash interest rates further, after surprising markets back in January when it cut rates into negative territory for the first time. The BOJ left rates unchanged and didn’t boost its stimulus measures currently in place.
In pharmaceutical news today, we heard that shares of Valeant Pharmaceuticals International (VRX) suffered their worst one-day plunge ever, losing more than half their value after the embattled drug maker issued lower earnings and financial forecasts and outlined potential bond defaults that could affect the firm’s borrowing. Ouch!
2. ETFs in the Spotlight
In case you missed the announcement and description of this section, you can read it here again.
It features 10 broadly diversified ETFs from my HighVolume list as posted every Monday. Furthermore, they are screened for the lowest MaxDD% number meaning they have been showing better resistance to temporary sell offs than all others over the past year.
Here are the 10 candidates:
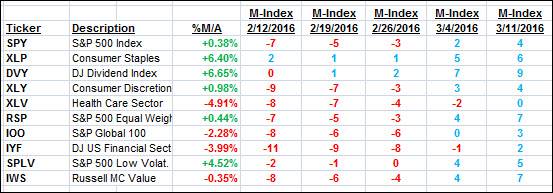
The above table simply demonstrates the magnitude with which some of the ETFs are fluctuating in regards to their positions above or below their respective individual trend lines (%M/A). A break below, represented by a negative number, shows weakness, while a break above, represented by a positive percentage, shows strength.
For hundreds of ETF/Mutual fund choices, be sure to reference Thursday’s StatSheet.
Year to date, here’s how the above candidates have fared so far:
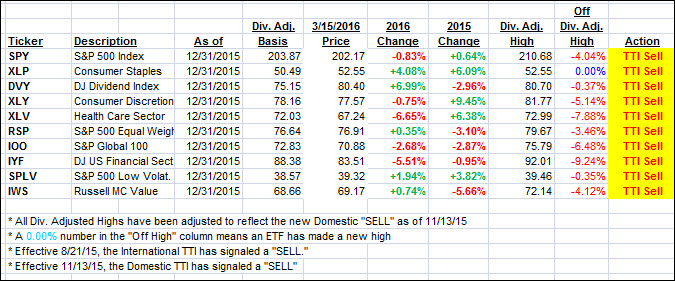
Again, the first table above shows the position of the various ETFs in relation to their respective long term trend lines (%M/A), while the second one tracks their trailing sell stops in the “Off High” column. The “Action” column will signal a “Sell” once the -7.5% point has been taken out in the “Off High” column.
3. Trend Tracking Indexes (TTIs)
Our Domestic Trend Tracking Index (TTI) slipped a little bit as the markets hovered tightly around the unchanged line in anticipation of tomorrow’s Fed announcement on interest rates.
Here’s how we closed:
Domestic TTI: -0.39% (last close -0.20%)—Sell signal effective 11/13/2015
International TTI: -4.40% (last close -3.72%)—Sell signal effective 8/21/2015
Disclosure: I am obliged to inform you that I, as well as advisory clients of mine, own some of these listed ETFs. Furthermore, they do not represent a specific investment recommendation for you, they merely show which ETFs from the universe I track are falling within the guidelines specified.
Contact Ulli