
1. Moving the Markets
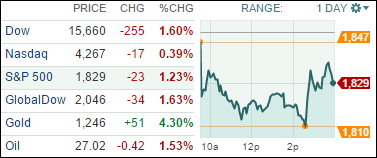
Sure, when all else fails to prop up the markets, start a rumor. Just as the S&P dipped towards the psychologically 1,800 level, the WSJ reported that the OPECers were “ready to cooperate” on a production cut.
That’s all it took, and the indexes staged their typical afternoon rally which, however, petered out but the losses of the day were cut by about 1%. Not helping the mood on Wall Street were Fed chief Yellen’s remarks during her second day of testimony, which lacked “hope” for the markets that interest rates might be cut.
All risk assets got slammed, and the clear winner of the day was gold, which rallied +4.3% while government bonds surged.
All of our 10 ETFs in the Spotlight succumbed to bearish forces and closed down. Faring the worst was the Financial ETF (IYF), which got clobbered at the tune of -2.66%. Resisting the sell-off the best was the Consumer Discretionary ETF (XLY) with -0.06%.
2. ETFs in the Spotlight
In case you missed the announcement and description of this section, you can read it here again.
It features 10 broadly diversified ETFs from my HighVolume list as posted every Monday. Furthermore, they are screened for the lowest MaxDD% number meaning they have been showing better resistance to temporary sell offs than all others over the past year.
Here are the 10 candidates:
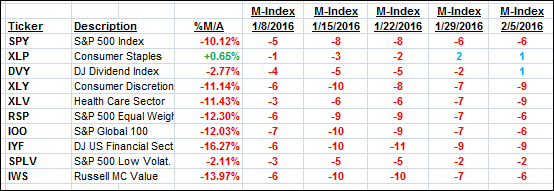
The above table simply demonstrates the magnitude with which some of the ETFs are fluctuating in regards to their positions above or below their respective individual trend lines (%M/A). A break below, represented by a negative number, shows weakness, while a break above, represented by a positive percentage, shows strength.
For hundreds of ETF/Mutual fund choices, be sure to reference Thursday’s StatSheet.
Year to date, here’s how the above candidates have fared so far:
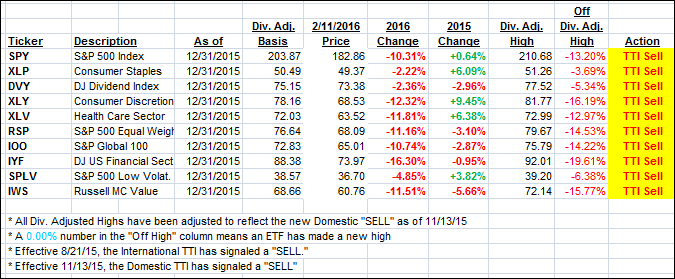
Again, the first table above shows the position of the various ETFs in relation to their respective long term trend lines (%M/A), while the second one tracks their trailing sell stops in the “Off High” column. The “Action” column will signal a “Sell” once the -7.5% point has been taken out in the “Off High” column.
3. Trend Tracking Indexes (TTIs)
Our Domestic Trend Tracking Index (TTI) headed south as the sell-off intensified confirming again that the bear is very much alive and well.
Here’s how we closed:
Domestic TTI: -3.84% (last close -3.54%)—Sell signal effective 11/13/2015
International TTI: -14.01% (last close -12.67%)—Sell signal effective 8/21/2015
Disclosure: I am obliged to inform you that I, as well as advisory clients of mine, own some of these listed ETFs. Furthermore, they do not represent a specific investment recommendation for you, they merely show which ETFs from the universe I track are falling within the guidelines specified.
Contact Ulli