1. Moving the Markets
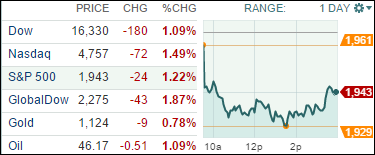
Renewed fears over China’s economic growth, a fresh rout in commodity markets and continued uncertainty over a Fed rate hike later this year triggered a heavy sell-off on Wall Street today. All three major benchmark indexes fell over 1.0% to close out the day, recovering from even larger deficits earlier in the day.
The agricultural chemicals company Mosaic (MOS) slid today after the company announced reduced production in its potash business due to unfavorable crop conditions.
Also hurting the Dow was news released about one of its influential components, Goldman Sachs (GS), which revealed that its CEO Lloyd Blankfein has a “highly curable” form of lymphoma. Goldman Sachs shares finished down 2%.
We heard from Groupon (GRPN) today. The technology up-and-comer announced that it is laying off 1,100 people, about 10% of its workforce, and is shutting down operations in seven countries, a sharp reversal of fortune at the height of its rebuffed multibillion-dollar buyout offer from Google. Groupon has decided to decide its own destiny and continue being a publicly traded company.
In positive news, shares of the oilfield services company Weatherford (WFT) saw substantial gains in its stock after it announced that it would not pursue previous plans for a public offering.
All of our 10 ETFs in the Spotlight succumbed to bearish forces today with the worst performer being the Global 100 (IOO), which gave back -1.73%. The best of the bunch turned out to be Healthcare (XLV) with a modest loss of -0.61%.
2. ETFs in the Spotlight
In case you missed the announcement and description of this section, you can read it here again.
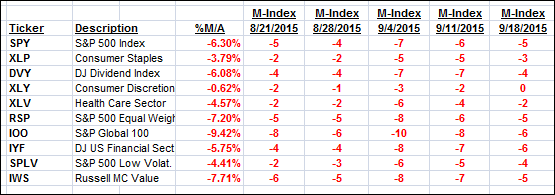
It features 10 broadly diversified ETFs from my HighVolume list as posted every Monday. Furthermore, they are screened for the lowest MaxDD% number meaning they have been showing better resistance to temporary sell offs than all others over the past year.
Here are the 10 candidates:
The above table simply demonstrates the magnitude with which some of the ETFs are fluctuating in regards to their positions above or below their respective individual trend lines (%M/A). A break below, represented by a negative number, shows weakness, while a break above, represented by a positive percentage, shows strength.
For hundreds of ETF/Mutual fund choices, be sure to reference Thursday’s StatSheet.
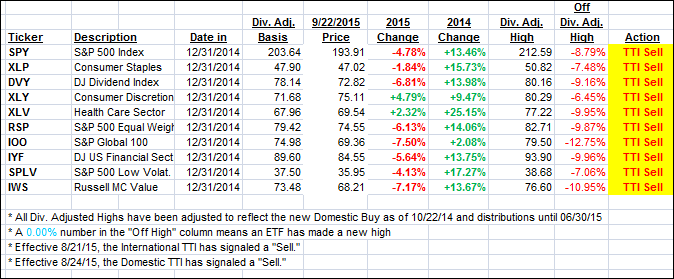
Year to date, here’s how the above candidates have fared so far:
Again, the first table above shows the position of the various ETFs in relation to their respective long term trend lines (%M/A), while the second one tracks their trailing sell stops in the “Off High” column. The “Action” column will signal a “Sell” once the -7.5% point has been taken out in the “Off High” column.
3. Trend Tracking Indexes (TTIs)
Our Trend Tracking Indexes (TTIs) slipped deeper into bear market territory. Downside momentum worsened in today’s session but last hour buying limited the damage.
Here’s how we ended up:
Domestic TTI: -2.01% (last close -1.48%)—Sell signal effective 8/24/2015
International TTI: -6.91% (last close -5.25%)—Sell signal effective 8/21/2015
Until the respective trend lines get clearly broken to the upside, we are staying on the sidelines.
Disclosure: I am obliged to inform you that I, as well as advisory clients of mine, own some of these listed ETFs. Furthermore, they do not represent a specific investment recommendation for you, they merely show which ETFs from the universe I track are falling within the guidelines specified.
Contact Ulli


