1. Moving the Markets
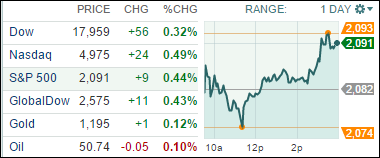
Gains were led mostly by energy stocks as oil prices rebounded slightly after Wednesday’s steep decline. U.S. benchmark crude rose 0.7% to $50.84 a barrel after plunging 6% the previous day on a larger-than-expected inventory build-up.
In tech, shares of Altera (ALTR) rose and Intel (INTC) fell on reports that Intel has ended talks to buy the semiconductor company. In auto news, we heard today that General Motors (GM) is halting production of the Chevy Volt extended-range electric car, because they need to clear out an unsold backlog. Volt sales the first quarter this year are just less than half what they were a year earlier.
The sale of these electric toys, of course, relates directly to the price of gas. With gas prices low so far this year, there has been a large financial disincentive to buy alternative-power vehicles.
And finally, a fun bit of buzz on the street today is that private equity firm Blackstone Group and Wells Fargo are close to a deal buy a real-estate portfolio valued at a whopping $30 billion from General Electric (GE). This has not been confirmed as of yet, but if the transaction did go through, it would be one of the largest real estate deals since pre-financial crisis of 2007.
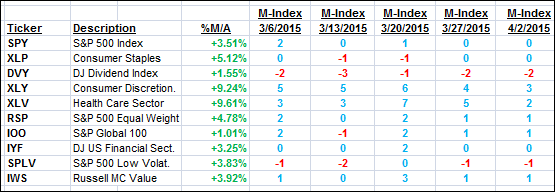
7 of our 10 ETFs in the Spotlight inched higher while 3 of them dropped. Leading the charge to the upside was Healthcare (XLV) with +0.75%, while SPLV ruled the downside with a slight loss of -0.24%.
2. ETFs in the Spotlight
In case you missed the announcement and description of this section, you can read it here again.
It features 10 broadly diversified ETFs from my HighVolume list as posted every Monday. Furthermore, they are screened for the lowest MaxDD% number meaning they have been showing better resistance to temporary sell offs than all others over the past year.
Here are the 10 candidates:
The above table simply demonstrates the magnitude with which some of the ETFs are fluctuating in regards to their positions above or below their respective individual trend lines (%M/A). A break below, represented by a negative number, shows weakness, while a break above, represented by a positive percentage, shows strength.
For hundreds of ETF/Mutual fund choices, be sure to reference Thursday’s StatSheet.
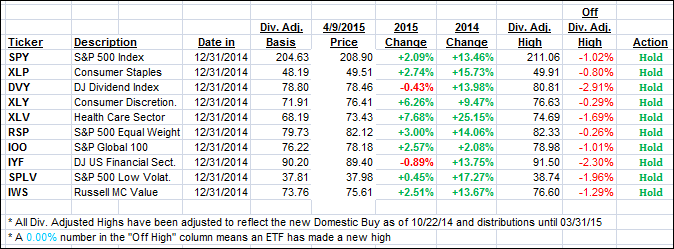
Year to date, here’s how the above candidates have fared so far:
Again, the first table above shows the position of the various ETFs in relation to their respective long term trend lines (%M/A), while the second one tracks their trailing sell stops in the “Off High” column. The “Action” column will signal a “Sell” once the -7.5% point has been taken out in the “Off High” column.
3. Trend Tracking Indexes (TTIs)
Our Trend Tracking Indexes (TTIs) continued their slow ascent deeper into bullish territory.
Here’s how we ended the day:
Domestic TTI: +3.30% (last close +3.17%)—Buy signal effective 10/22/2014
International TTI: +4.86% (last close +4.62%)—Buy signal effective 2/13/2015
Disclosure: I am obliged to inform you that I, as well as advisory clients of mine, own some of these listed ETFs. Furthermore, they do not represent a specific investment recommendation for you, they merely show which ETFs from the universe I track are falling within the guidelines specified.
Contact Ulli


