
1. Moving the Markets
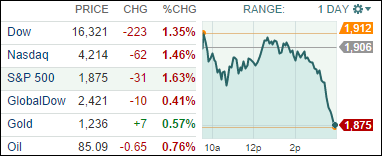
Stocks resumed their recent trend of spiraling downward to begin this week. A late-day selloff on Wall Street smashed hopes for a rebound rally after last week’s plunge, which pushed major indexes closer to a 10% correction. All major indexes slipped as the chart above shows. As a side note, this marked the Dow’s fifth straight triple-digit move, of which only one of them was positive!
In tech, GoPro (GPRO) dropped 8% today on reports that a retired race car driver sustained serious head injuries while wearing one of the company’s cameras skiing last year. As you may know, the stock has been on a rapid uptrend since its IPO earlier this year. GoPro cameras are often mounted on the top of helmets worn by extreme sports enthusiasts.
In the air, Boeing (BA) announced on Sunday that it received a massive order from Guarda Indonesia for 50 jets that amounted to a purchase price of $4.9 billion. Garuda Indonesia currently operates 77 Boeing 737s. Specifically, the airline will purchase 46 737 MAX 8s and will convert existing orders for four Next-Generation 737-800s to 737 MAX 8s. The first delivery of a 737 Max to an airline is scheduled for 2017.
Anxiety on Wall Street has been accelerated by continued uncertainty about how markets will react as the Fed nears the expected end of its market-friendly bond- buying program later this month and plots its first interest rate hike sometime next year. Also, the increased presence of Ebola in the U.S. is not helping market uncertainties.
All of our 10 ETFs in the Spotlight headed south as the move into bear market territory intensified. For more details please see section 3 below.
2. ETFs in the Spotlight
In case you missed the announcement and description of this section, you can read it here again.
It features 10 broadly diversified ETFs from my HighVolume list as posted every Monday. Furthermore, they are screened for the lowest MaxDD% number meaning they have been showing better resistance to temporary sell offs than all others over the past year.
Here are the 10 candidates:
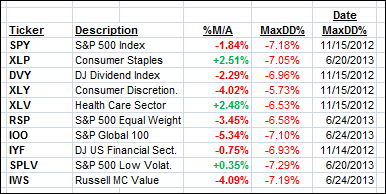
Only 3 of them are currently in “buy” mode, meaning their prices are above their respective long term trend lines by the percentage indicated (%M/A).
Year to date, here’s how the above candidates have fared so far:
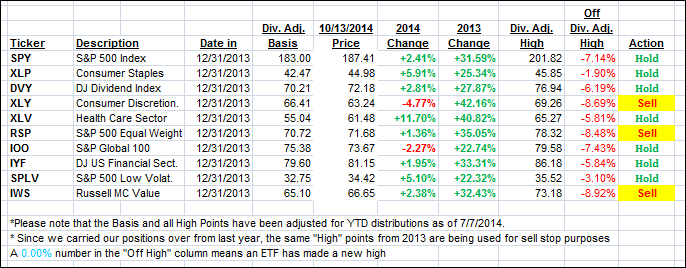
To be clear, the first table above shows the position of the various ETFs in relation to their respective long term trend lines (%M/A), while the second one tracks their trailing sell stops in the “Off High” column. The “Action” column will signal a “Sell” once the -7.5% point is taken out in the “Off High” column.
3. Domestic Trend Tracking Indexes (TTIs)
Our Trend Tracking Indexes (TTIs) continued to slip deeper into bear market territory. We have now reached the level, much faster than I thought, were the Domestic TTI has now clearly broken its long-term trend line to the downside and therefore has generated a Sell signal to move out of “broadly diversified domestic equity mutual fund/ETF” positions and to the safety of our money market accounts. The effective date for monitoring purposes will be 10/14/2014.
In my advisor practice, I started the liquidation process this morning, and I hope to complete it by tomorrow. As is my habit, I will watch the market opening first to see if there is any substantial rebound in the making. If there is, I may hold off with my remaining sales for another day. If there isn’t, I will execute as planned.
Here’s how we closed the day:
Domestic TTI: -1.00% (last close -0.39%)
International TTI: -5.62% (last close -4.81%)—Sell signal effective 10/1/2014
Disclosure: I am obliged to inform you that I, as well as advisory clients of mine, own some of these listed ETFs. Furthermore, they do not represent a specific investment recommendation for you, they merely show which ETFs from the universe I track are falling within the guidelines specified.
Contact Ulli