1. Moving The Markets
Stocks returned with a bang today and once again we saw the S&P 500 close out the day at a new record high. Yesterday, the Ukraine conflict had investors biting their nails, but as tensions eased today (with Putin saying he would only use force as a last resort) those same investors were all smiles again.
Walt Disney Co (DIS) shares rose 2.8% to a record high of $81.71 intraday after reaching a deal with Dish Network (DISH) that lets the No. 2 satellite TV provider carry Disney-owned networks such as ABC and ESPN, and deliver the content outside of a traditional TV subscription. RadioShack (RSH), a name too often associated with ‘outdated’ announced that it will close up another 1,100 stores across the country after undergoing a massive drop in holiday sales.
As stocks rebounded today, gold fell, of course, as well as treasury prices and the Yen. Oil prices also retreated as Putin’s gesture reduced the chances that energy supply from Russia, the No. 2 world oil exporter, could be disrupted or subject to sanctions. While the markets may have corrected upwards today, do remember that they have been very volatile and reactionary in the short term this year. On the bright side though, they keep trending upwards, which is confirmed by our Trend Tracking Indexes (TTIs).
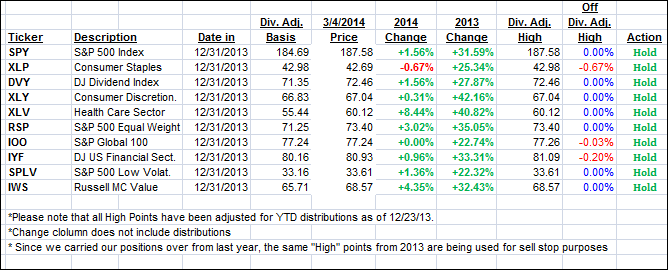
Our 10 ETFs in the Spotlight joined the rally with 7 of them making new highs and 9 of them moving on the plus side YTD.
2. ETFs in the Spotlight
In case you missed the announcement and description of this section, you can read it here again.
It features 10 broadly diversified ETFs from my HighVolume list as posted every Monday. Furthermore, they are screened for the lowest MaxDD% number meaning they have been showing better resistance to temporary sell offs than all others over the past year.
In other words, none of them ever triggered their 7.5% sell stop level during this time period, which included a variety of severe market pullbacks but no move into outright bear market territory.
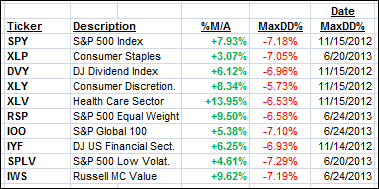
Here are the 10 candidates:
All of them are in “buy” mode meaning their prices are above their respective long term trend lines by the percentage indicated (%M/A).
Year to date, here’s how the above candidates have fared so far:
To be clear, the first table above shows the position of the various ETFs in relation to their respective long term trend lines (%M/A), while the second one tracks their trailing sell stops in the “Off High” column.
3. Domestic Trend Tracking Indexes (TTIs)
Our Trend Tracking Indexes (TTIs) rallied sharply and reached the following positions in regards to their respective long-term trend lines:
Domestic TTI: +4.74% (last close +4.03%)
International TTI: +6.15% (last close +4.87%)
Disclosure: I am obliged to inform you that I, as well as advisory clients of mine, own some of these listed ETFs. Furthermore, they do not represent a specific investment recommendation for you, they merely show which ETFs from the universe I track are falling within the guidelines specified.
Contact Ulli


