1. Moving The Markets
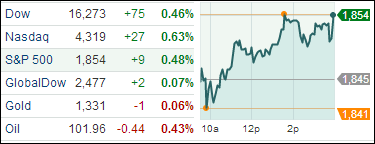
The S&P 500 had moved above its previous record many times this week, only to fade in the afternoon. After coming close, the index finally reached an all-time high today. Strong earnings from a number of U.S. companies, including the drugmaker Mylan and several retailers, provided just enough jet fuel to keep the S&P above the high water mark by closing. Some analysts feel that the positive market sentiment February has seen bodes well as we enter March, which has traditionally been one of the stronger performing months of the calendar year over the last 30 years.
Many investors were awaiting Janet Yellen’s speech today; however, there were no big shockers from the Chair of the Federal Reserve. Yellen’s comments did not indicate that the central bank could lower the pace of its stimulus reduction, so investors felt some relief that there were no negative surprises.
Japan’s Nikkei average fell for a second day on Thursday, moving further away from a four-week closing hit earlier this week. Many relate the recent decline to the heightened tensions in Ukraine that have impacted index heavyweights like SoftBank.
Oil prices dropped slightly today but held above $102 a barrel. Expectations for reduced demand due to warmer weather collided with a smaller-than-expected increase in U.S. oil supplies. Investors will be watching for new policy initiatives from China’s annual legislative session in early March to see what steps the government might take to shore up growth.
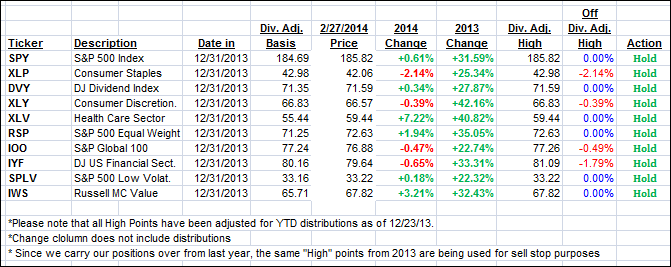
Our 10 ETFs in the Spotlight moved higher with the major indexes with 6 of them having turned positive for the year.
2. ETFs in the Spotlight
In case you missed the announcement and description of this section, you can read it here again.
It features 10 broadly diversified ETFs from my HighVolume list as posted every Monday. Furthermore, they are screened for the lowest MaxDD% number meaning they have been showing better resistance to temporary sell offs than all others over the past year.
In other words, none of them ever triggered their 7.5% sell stop level during this time period, which included a variety of severe market pullbacks but no move into outright bear market territory.
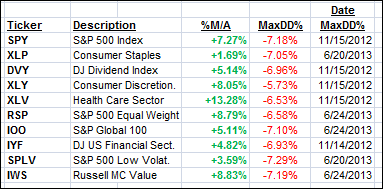
Here are the 10 candidates:
All of them are in “buy” mode meaning their prices are above their respective long term trend lines by the percentage indicated (%M/A).
Year to date, here’s how the above candidates have fared so far:
To be clear, the first table above shows the position of the various ETFs in relation to their respective long term trend lines (%M/A), while the second one tracks their trailing sell stops in the “Off High” column.
3. Domestic Trend Tracking Indexes (TTIs)
Our Trend Tracking Indexes (TTIs) headed higher, although the International TTI was clearly lagging during this move:
Domestic TTI: +4.31% (last close +3.97%)
International TTI: +6.37% (last close +6.32%)
Contact Ulli


