
- Moving the market
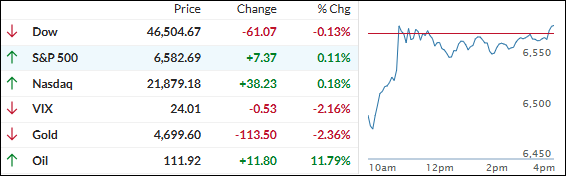
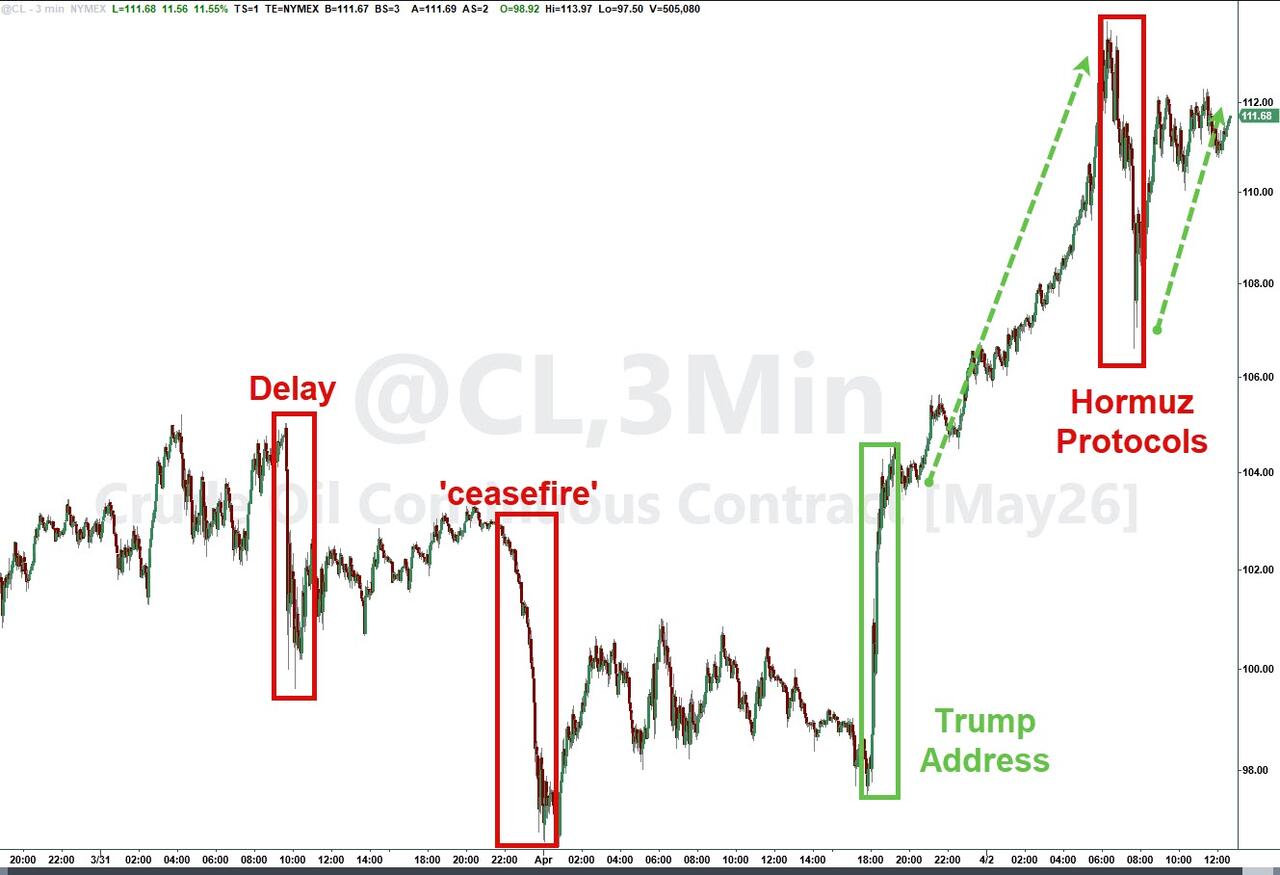
The Dow opened with a sharp 600-point drop as traders kept watching the Iran war and rising oil prices (crude surged around 11%).
But the major indexes staged a solid comeback after Iranian state media said the country is working with Oman on a protocol to let ships pass through the Strait of Hormuz again.
One analyst put it this way: “It’s pivotal for the United States that the Strait is reopened, not so much because of oil but because of helium. Currently in our own domestic economy, helium is more valuable than foreign oil because it’s used to cool the processing of semiconductors and there is no substitute for it.”
President Trump gave an address Wednesday night, saying the U.S. is “getting very close” to ending the war but warning that America would “hit Tehran extremely hard” if needed.
In the end, only the S&P 500 and Nasdaq managed tiny gains, while the Dow closed a tad lower.
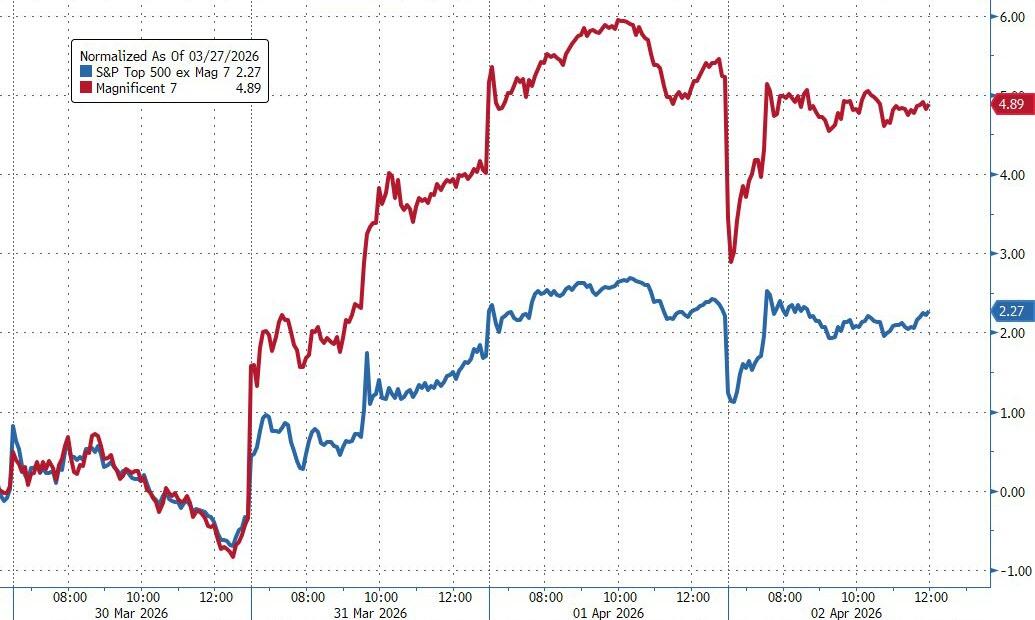
For the holiday-shortened week, the indexes rebounded nicely and posted their first up week since the war began. The Mag 7 showed signs of life again by outperforming the rest of the S&P 493.
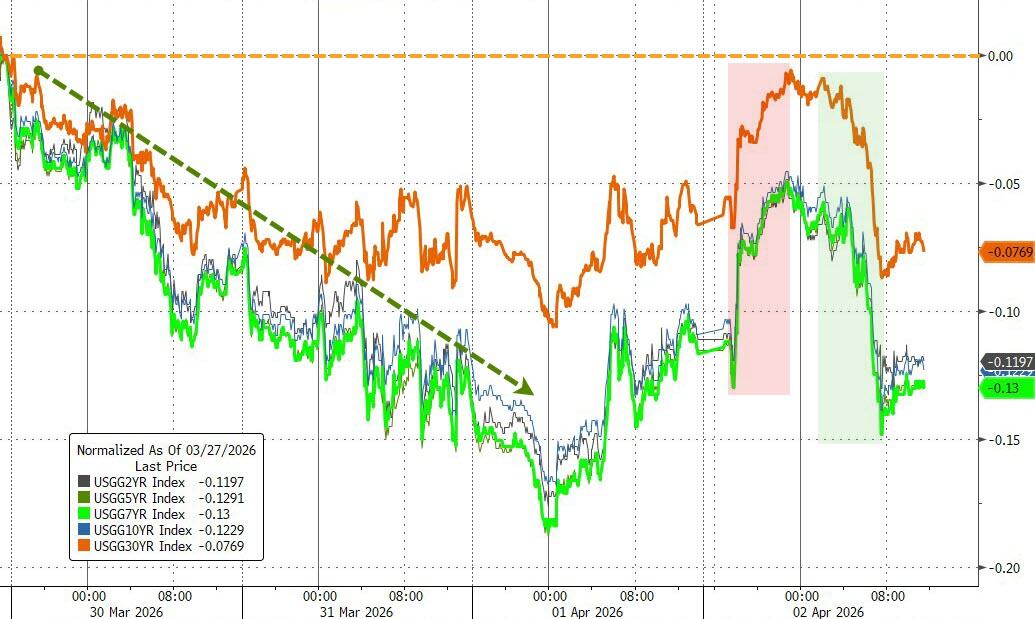
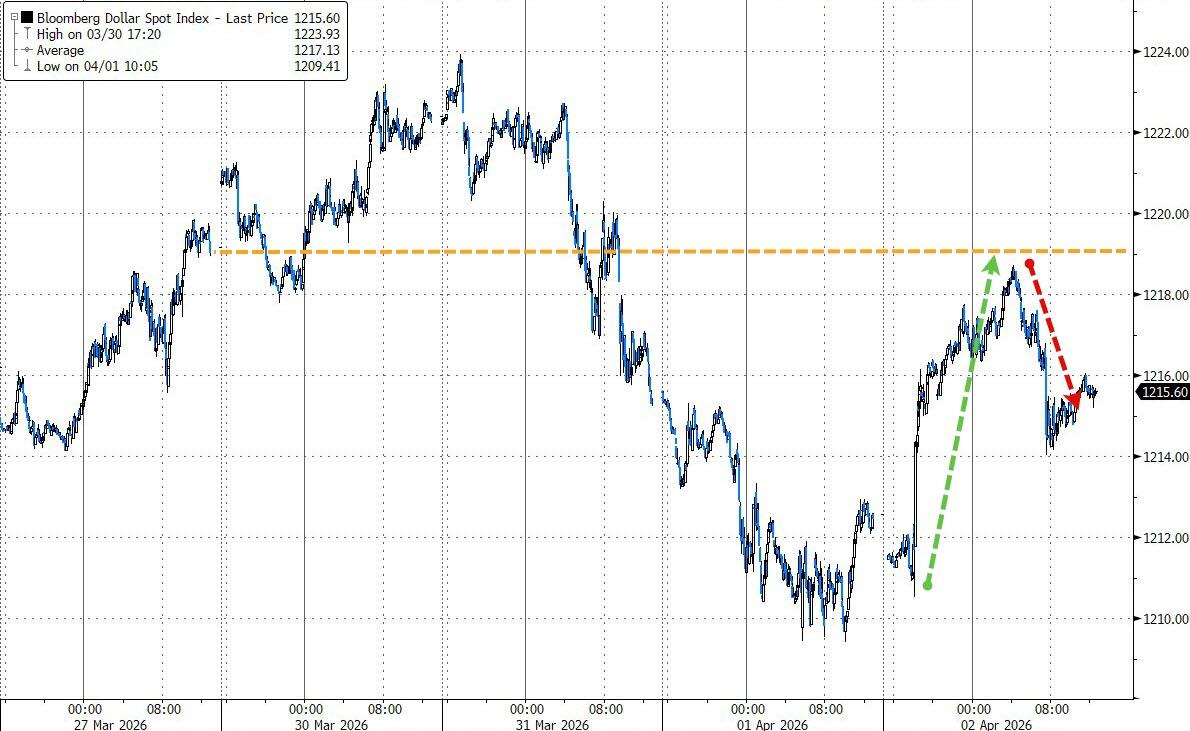
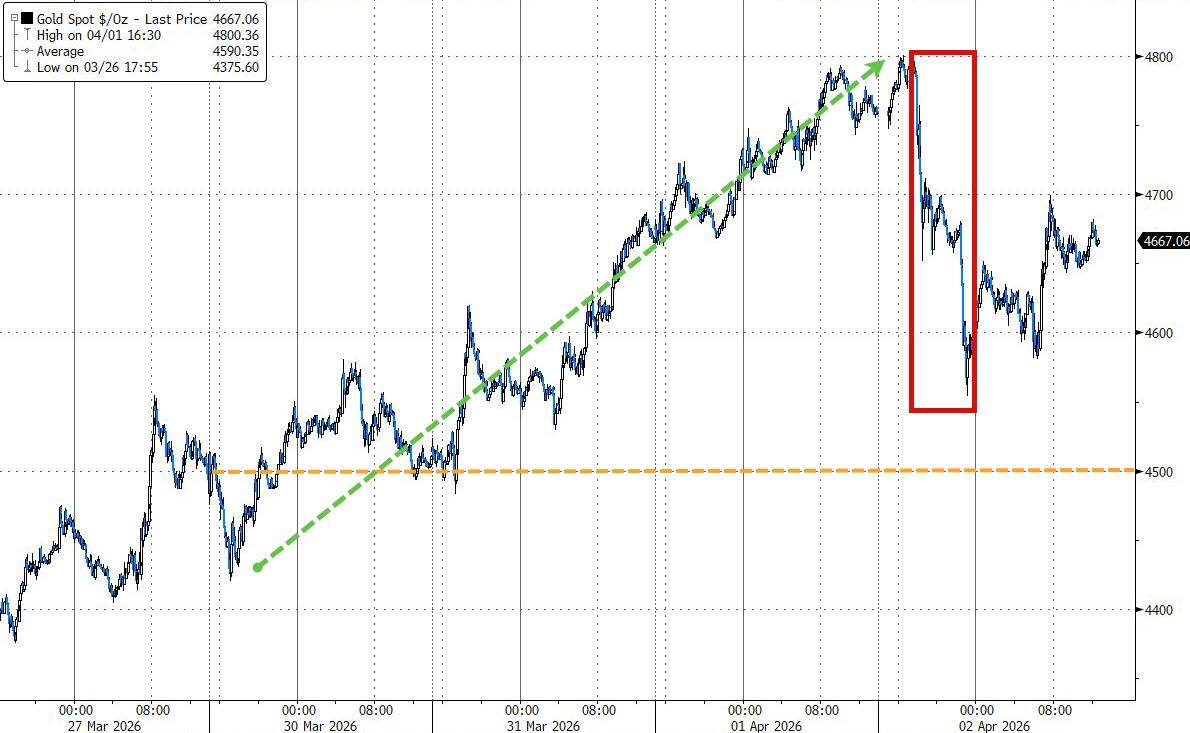
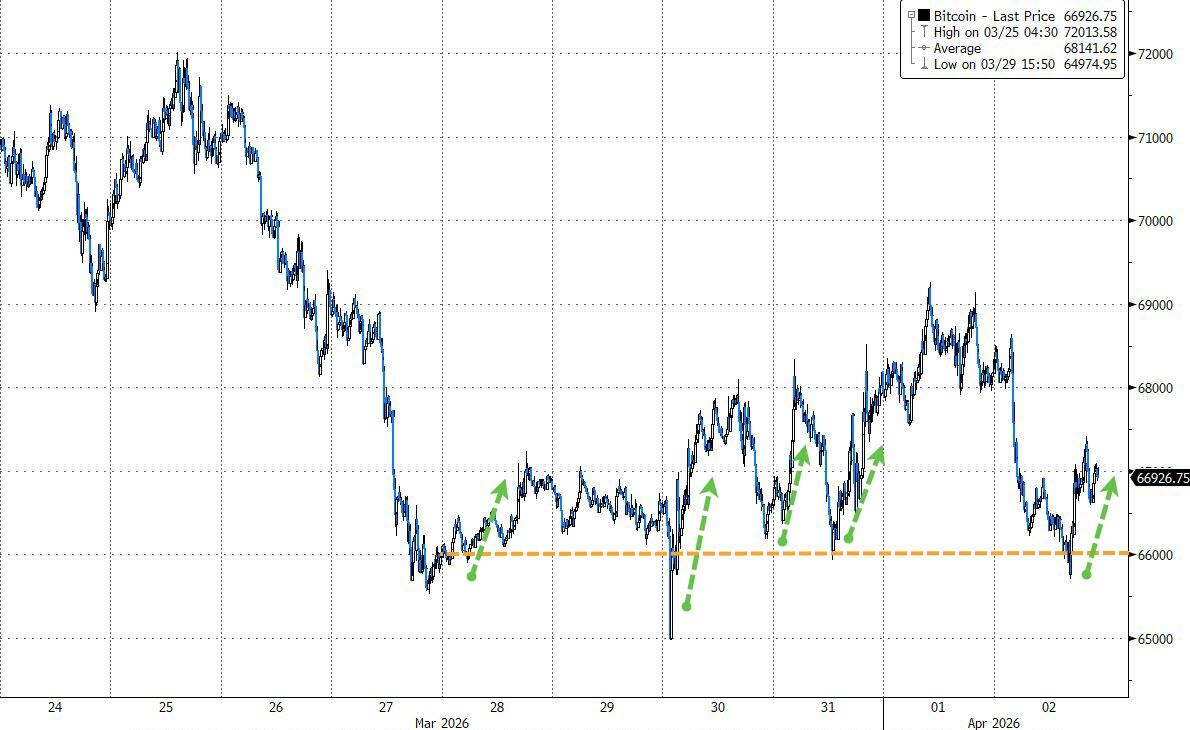
Bond yields eased, the dollar weakened, gold rallied strongly (holding firm despite an overnight plunge), and Bitcoin ended marginally higher than Friday’s close.
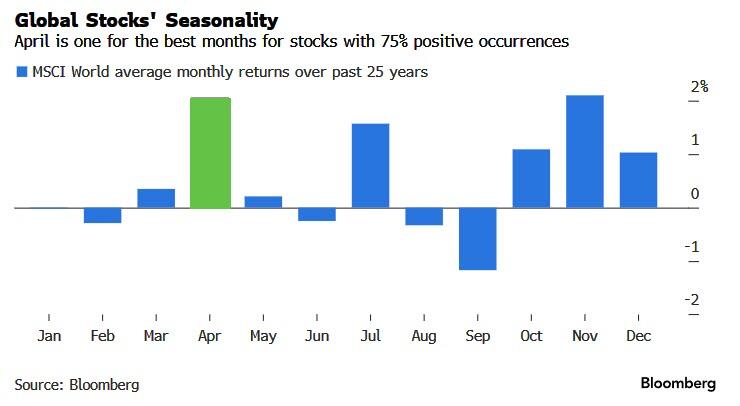
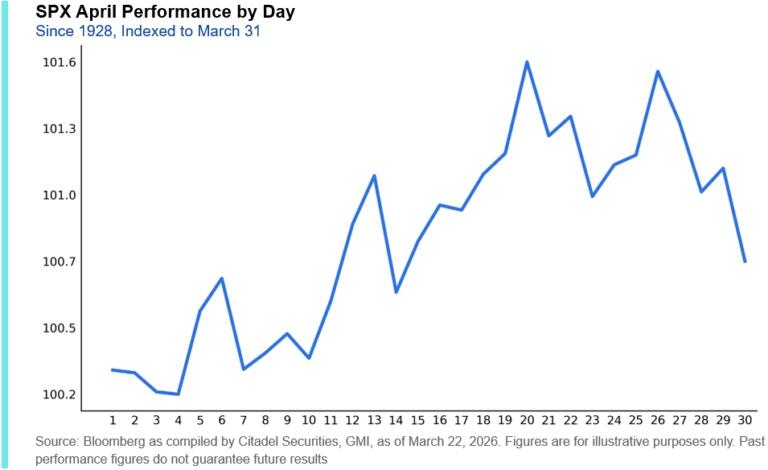
Some traders are heading into the long Easter weekend with a bit of optimism, mainly because April has historically been one of the best months for global stocks (along with November), and the S&P 500 also seasonally tends to perform well in April.
Continue reading…
2. Current domestic “Buy” Cycle (effective 5/20/2025); International “Buy” Cycle (effective 5/8/25)
Our domestic bullish cycle that began on November 21, 2023, concluded on April 3, 2025, following a market downturn triggered by President Trump’s tariff policy announcement.
This development caused significant declines across major indexes and broader market indices. However, markets subsequently rebounded, culminating in a new domestic “Buy” signal taking effect May 20, 2025.
Concurrently, our International Trend Tracking Index (TTI) experienced parallel volatility. On April 4, 2025, it breached critical thresholds, prompting a “Sell” recommendation. This position reversed as global markets recovered, with the International TTI regaining sufficient momentum to issue a new “Buy” signal effective May 8, 2025.
3. Trend Tracking Indexes (TTIs)
The day started with a sharp sell-off that had everything looking pretty ugly early on.
But the dip turned out to be short-lived — the major indexes clawed back most of their losses and ended up closing right around the unchanged line.
Nothing dramatic, just a quiet recovery.
Our TTIs followed a similar script. They pulled back with the market early but recovered later; in the end, only the domestic TTI managed to squeeze out a small green close.
This is how we closed 04/02/2026:
Domestic TTI: +1.55% above its M/A (prior close +1.40%)—Buy signal effective 5/20/25.
International TTI: +4.17% above its M/A (prior close +4.78%)—Buy signal effective 5/8/25.
All linked charts above are courtesy of Bloomberg via ZeroHedge.
———————————————————-
WOULD YOU LIKE TO HAVE YOUR INVESTMENTS PROFESSIONALLY MANAGED?
Do you have the time to follow our investment plans yourself? If you are a busy professional who would like to have his portfolio managed using our methodology, please contact me directly to get more details.
Contact Ulli