
- Moving the market
Stocks jumped right out of the gate after a new report gave investors fresh hope that the U.S.-Iran war might be winding down.
The WSJ said President Trump had told aides he’s willing to end military hostilities even if the Strait of Hormuz stays largely shut. That headline was enough to spark a strong rebound.
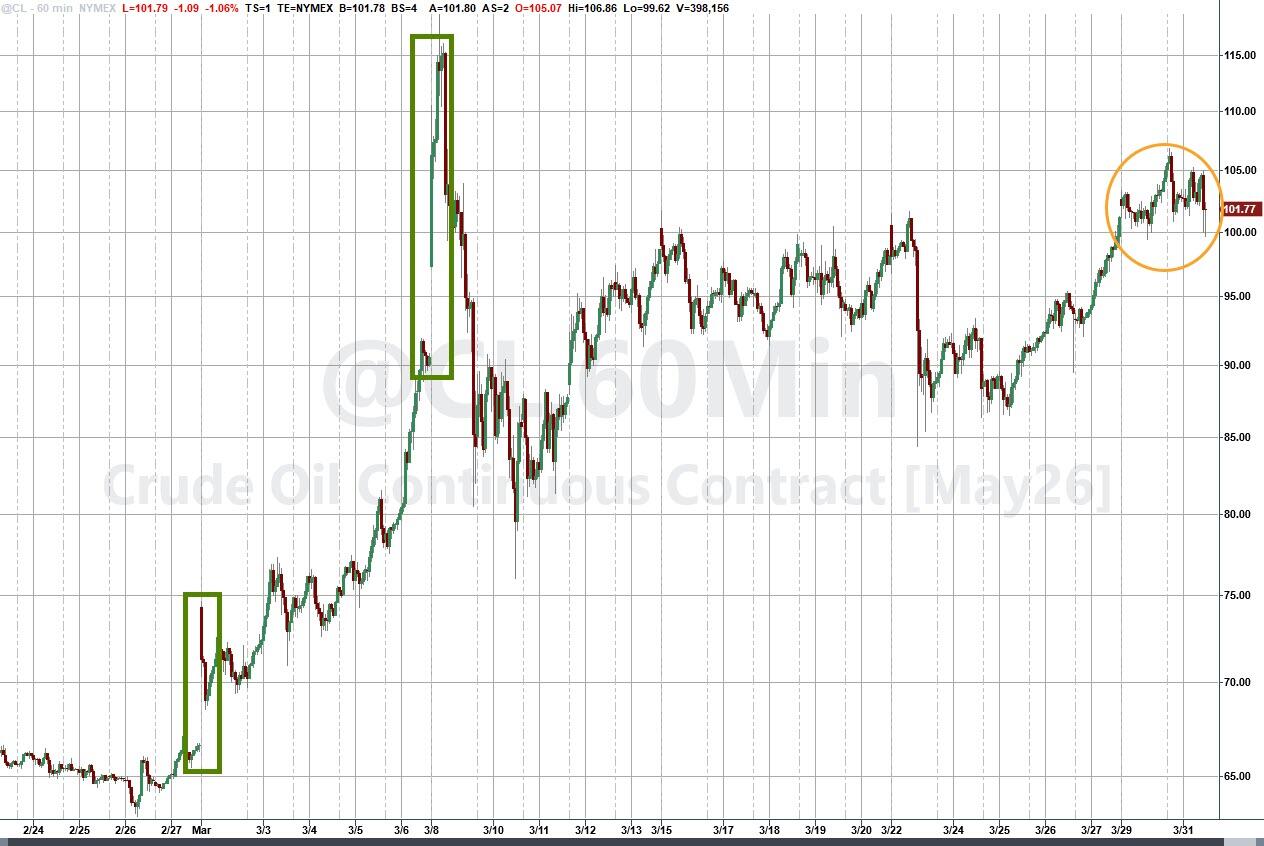
Crude prices stayed elevated anyway—WTI held above $100—after Bloomberg reported Iran struck a Kuwaiti oil tanker in Dubai waters.
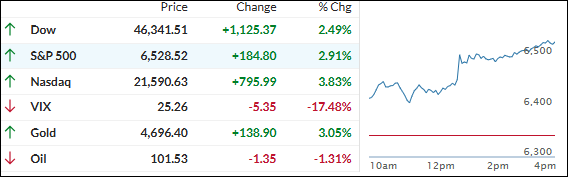
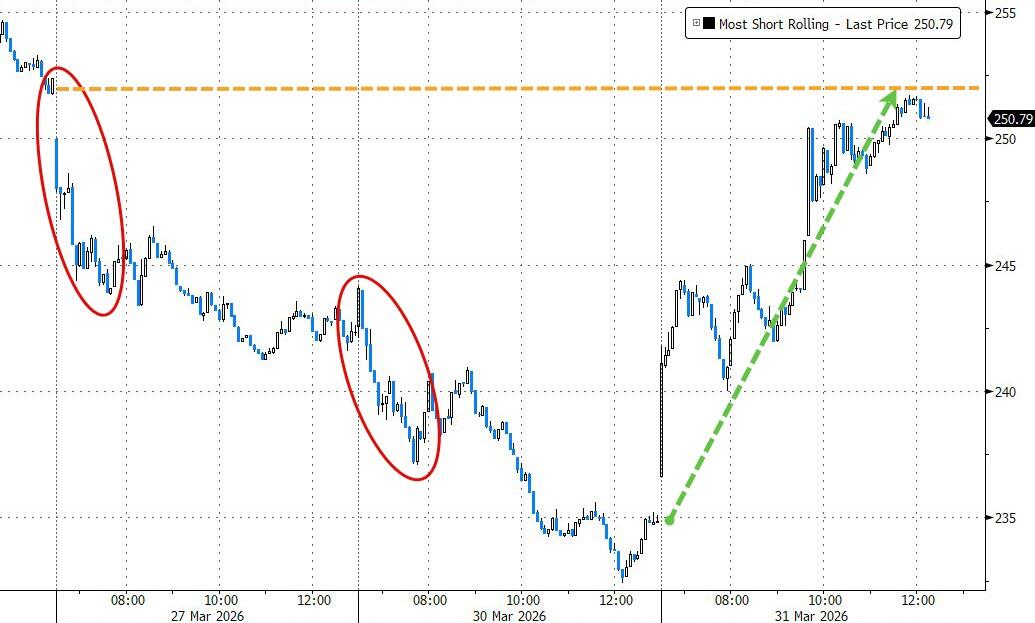
Still, the overall mood shifted bullish, and the major indexes posted their best day since May. The Dow, S&P 500, and Nasdaq all climbed nicely, with a massive short squeeze helping small caps surge over 3.5%.
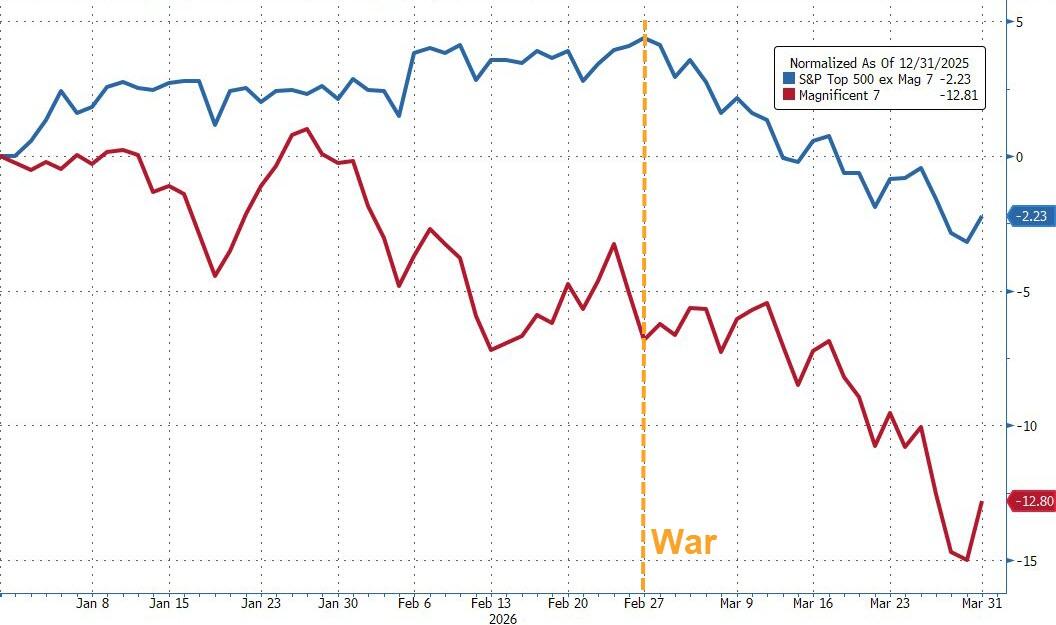
For the full month of March, however, it was a different story: all the major indexes finished down around 6% in sync, with energy being the only sector to end in the green. The Mag 7 dramatically underperformed the rest of the S&P 493 for the month and year-to-date.
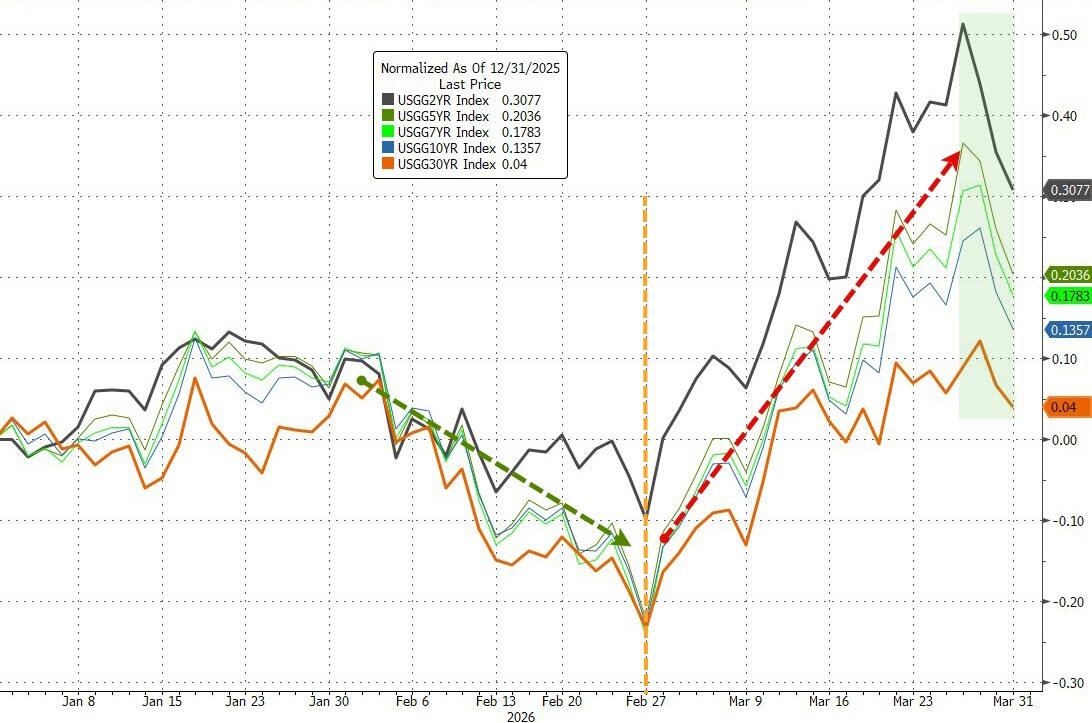
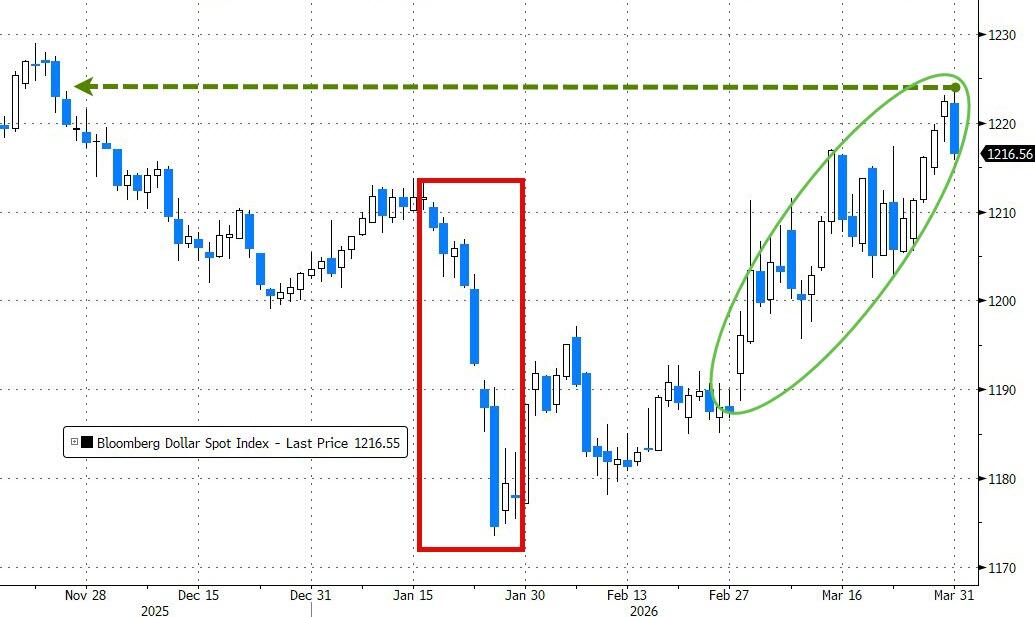
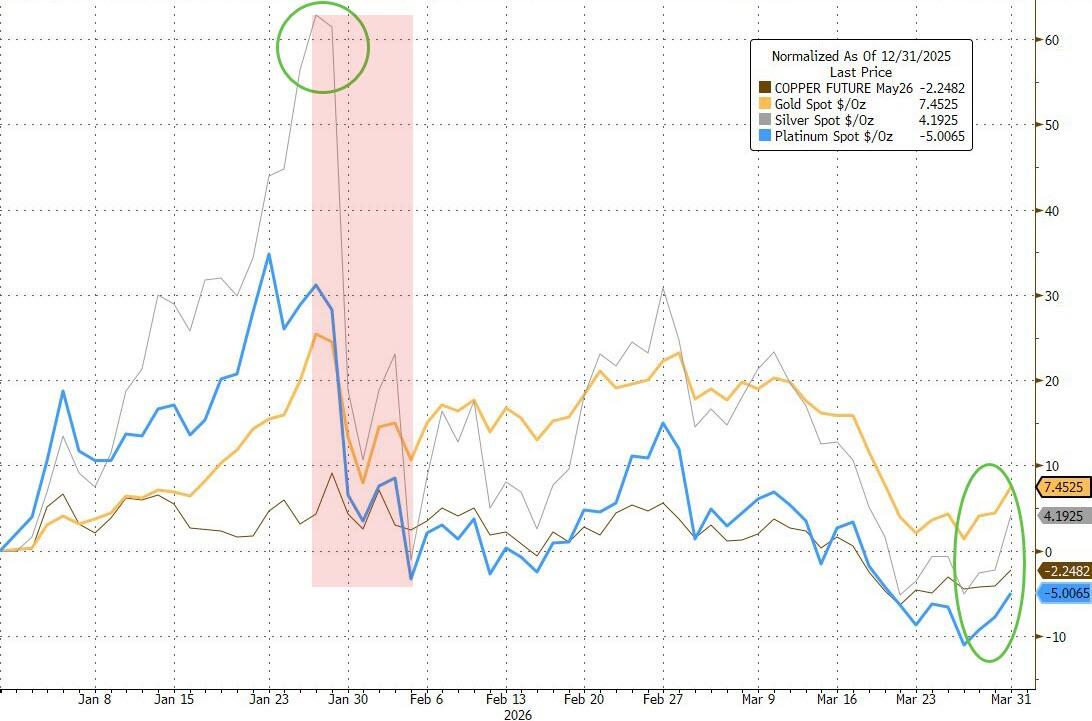
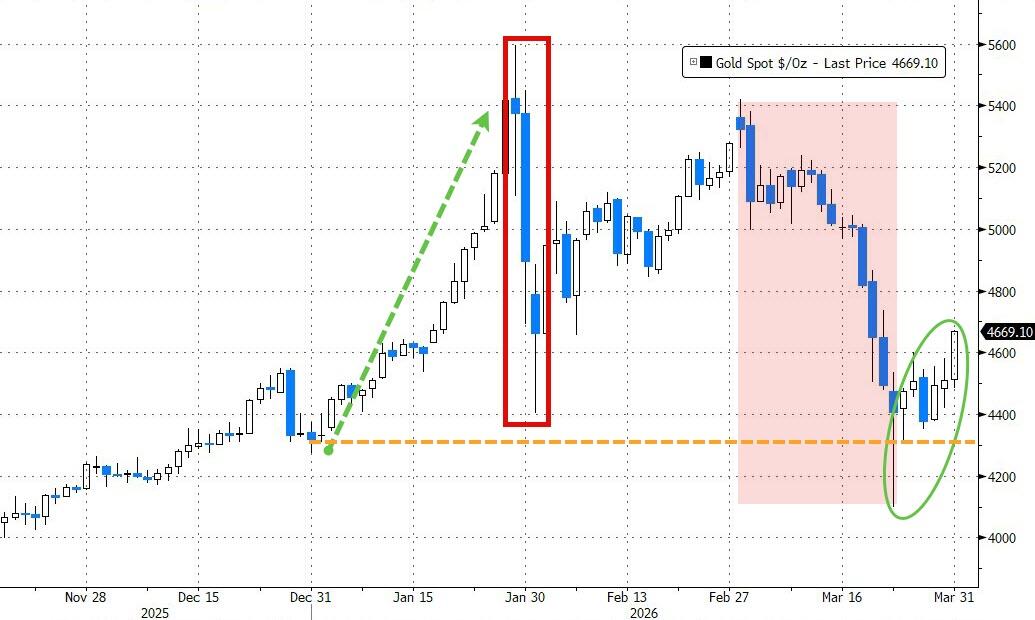
Bond yields rose, the dollar rallied, and gold—despite cratering 12% in March (its worst month since October 2008)—bounced back strongly today and is now up in 9 of the last 10 quarters.
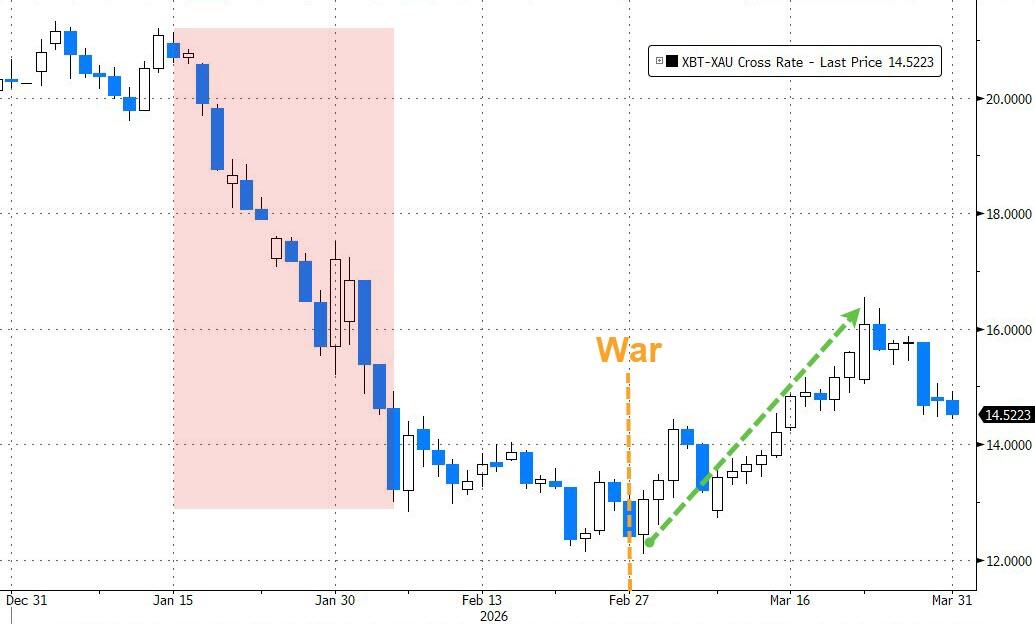
Bitcoin slumped during Q1 but ended March modestly higher and appears to have found a temporary bottom when the war started.
Today’s turnaround was welcome, but if traders decide the latest jawboning was just hot air or that the U.S. doesn’t really control how this ends, this green day could turn out to be nothing more than a one-off outlier.
2. Current domestic “Buy” Cycle (effective 5/20/2025); International “Buy” Cycle (effective 5/8/25)
Our domestic bullish cycle that began on November 21, 2023, concluded on April 3, 2025, following a market downturn triggered by President Trump’s tariff policy announcement.
This development caused significant declines across major indexes and broader market indices. However, markets subsequently rebounded, culminating in a new domestic “Buy” signal taking effect May 20, 2025.
Concurrently, our International Trend Tracking Index (TTI) experienced parallel volatility. On April 4, 2025, it breached critical thresholds, prompting a “Sell” recommendation. This position reversed as global markets recovered, with the International TTI regaining sufficient momentum to issue a new “Buy” signal effective May 8, 2025.
3. Trend Tracking Indexes (TTIs)
Optimism about a potential U.S.-Iran truce got bullish sentiment going right from the open.
Despite plenty of geopolitical jawboning, no fresh news came out to spoil the mood, so the major indexes and the metals complex powered higher and delivered a solid green close.
Our TTIs caught the same positive vibes—both stayed in rally mode, and the domestic one jumped back into positive territory.
This is how we closed 03/31/2026:
Domestic TTI: +1.07% above its M/A (prior close -0.95%)—Buy signal effective 5/20/25.
International TTI: +3.17% above its M/A (prior close +1.74%)—Buy signal effective 5/8/25.
All linked charts above are courtesy of Bloomberg via ZeroHedge.
———————————————————-
WOULD YOU LIKE TO HAVE YOUR INVESTMENTS PROFESSIONALLY MANAGED?
Do you have the time to follow our investment plans yourself? If you are a busy professional who would like to have his portfolio managed using our methodology, please contact me directly to get more details.
Contact Ulli