
- Moving the market
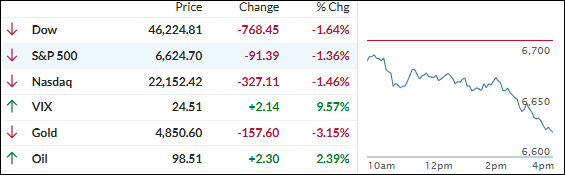
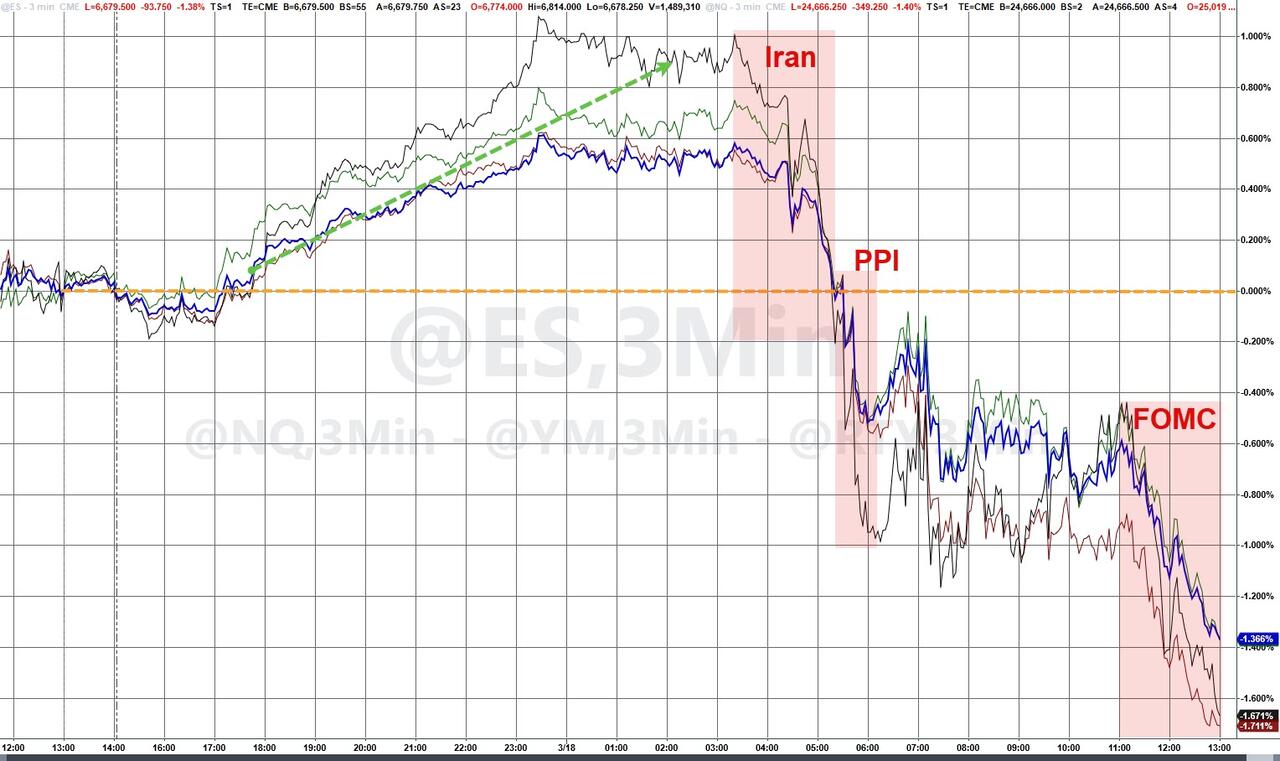
The major indexes opened lower and stayed under pressure all day, as a hotter-than-expected producer price index (PPI) report added fuel to inflation worries.
The PPI—measuring wholesale prices—jumped 0.7% in February, way above the 0.3% economists had forecast. That came on top of the ongoing Iran war, which has already jacked up oil prices and stoked stagflation fears (rising inflation + slowing growth).
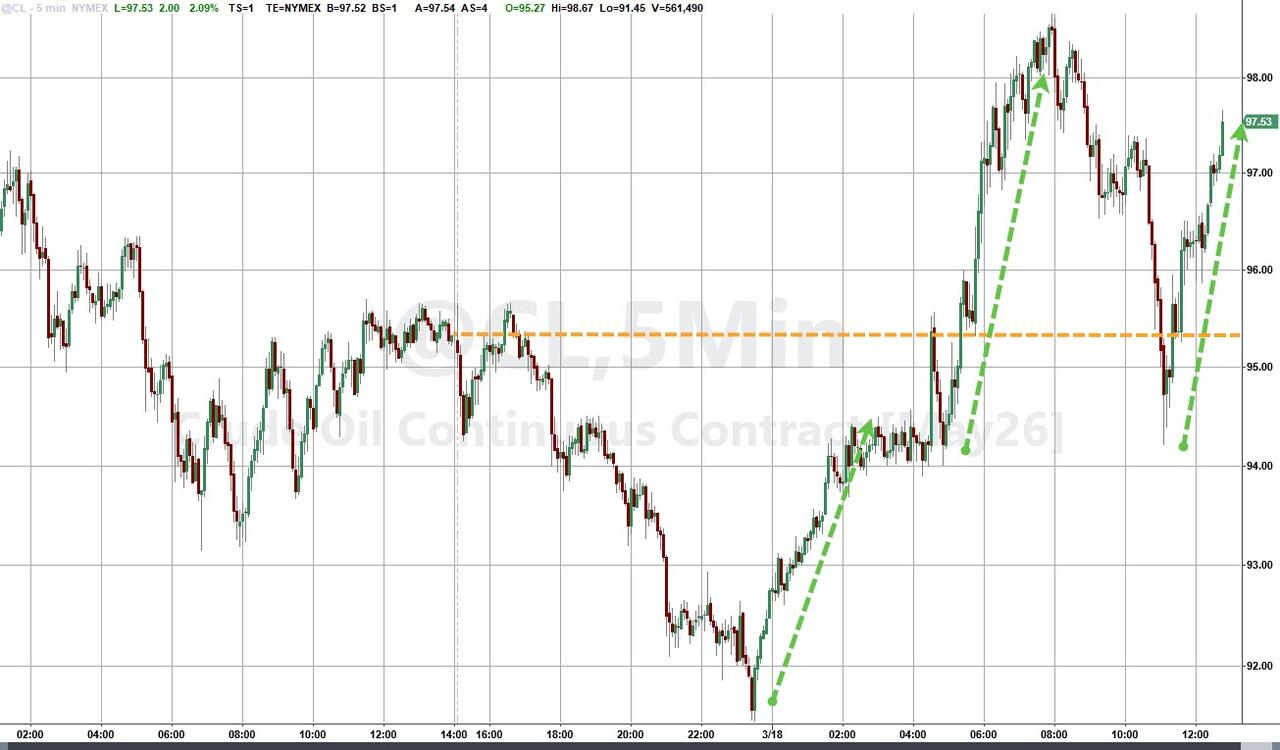
West Texas Intermediate crude climbed more than 2% to around $98 a barrel, while Brent jumped over 5% to $109. The spike followed reports of Israel striking Iran’s largest gas processing facility in Bushehr Province, plus Iran’s threats to target oil facilities in Saudi Arabia, the UAE, and Qatar.
The Fed did exactly what was expected—held rates steady—but the hotter inflation data made them sound to get more hawkish if needed, with price stability now front and center.
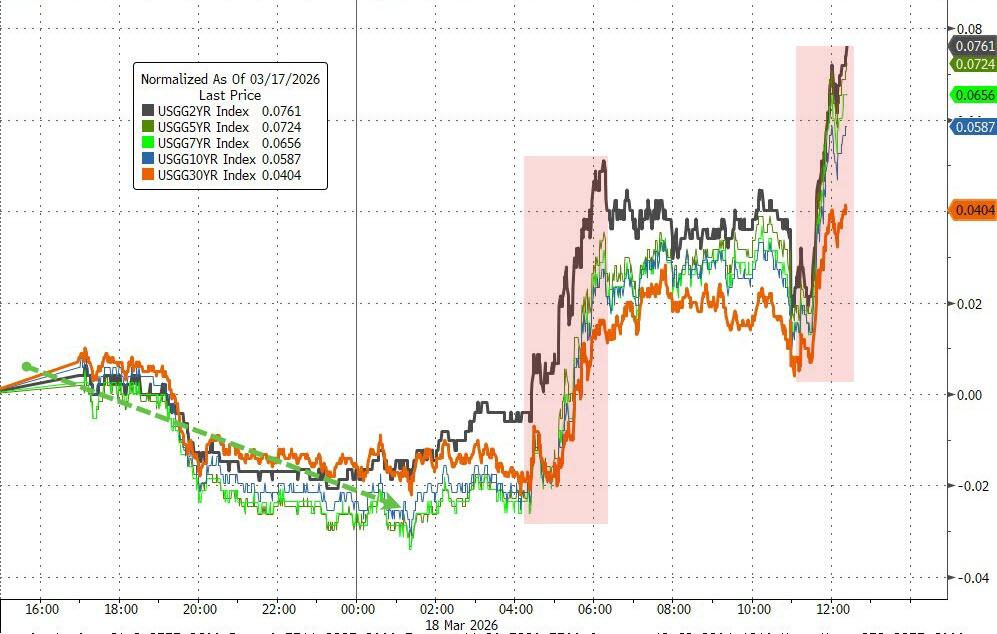
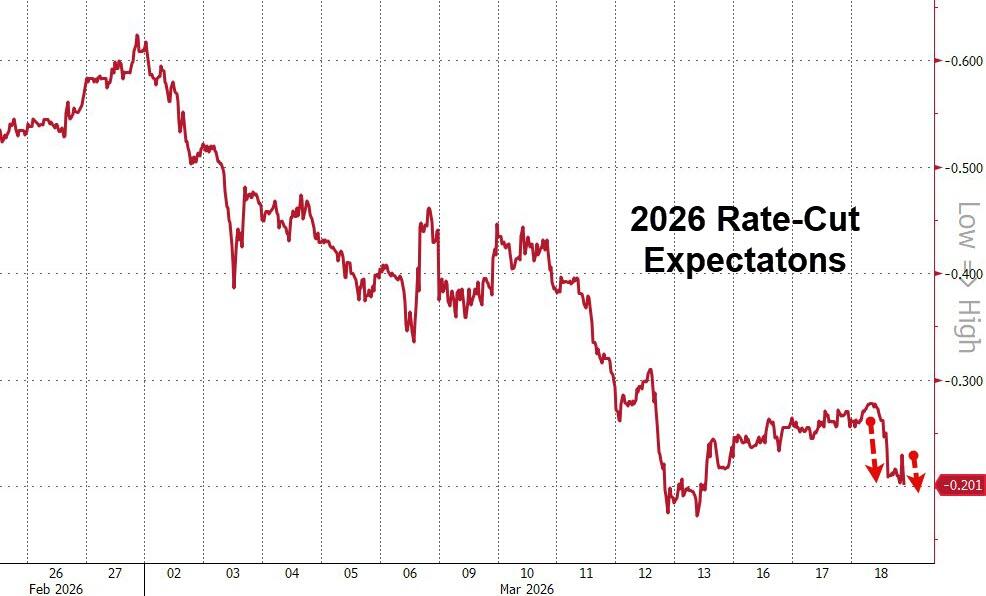
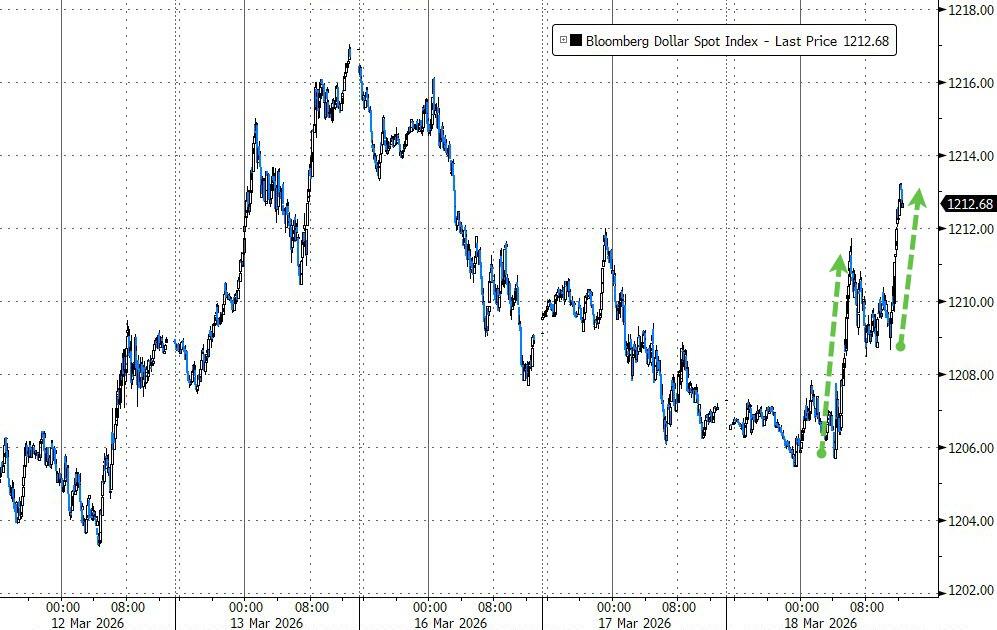
None of that was market-friendly, so we got another broad sea of red. Bond yields rose sharply (nailing the coffin on equities), rate-cut expectations sank, and the dollar pushed higher.
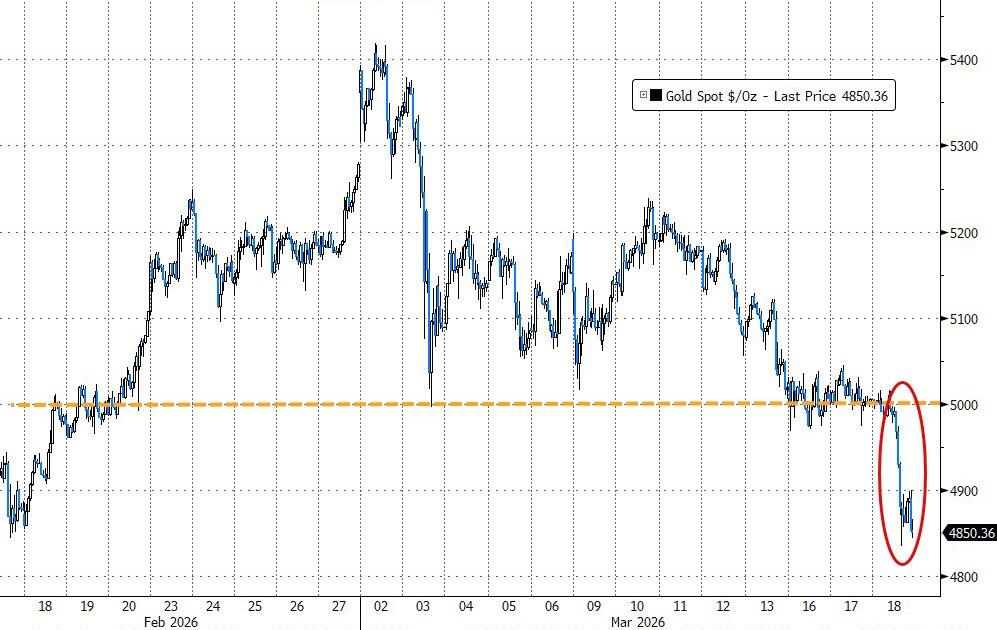
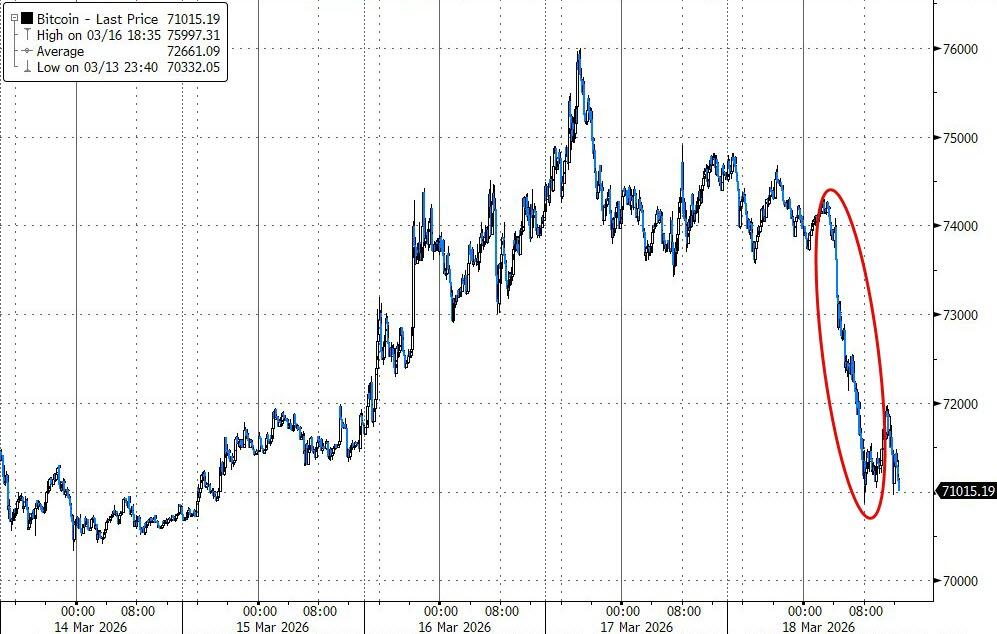
There was no real safe haven today—gold puked and lost its $5,000 level, the metals complex generally sold off, and Bitcoin reversed course but found support around $71K.
I’m wondering if dip buyers are still alive and ready to step in to save the markets from further turmoil, or if this kind of pressure might need more time to play out.
Continue reading…
2. Current domestic “Buy” Cycle (effective 5/20/2025); International “Buy” Cycle (effective 5/8/25)
Our domestic bullish cycle that began on November 21, 2023, concluded on April 3, 2025, following a market downturn triggered by President Trump’s tariff policy announcement.
This development caused significant declines across major indexes and broader market indices. However, markets subsequently rebounded, culminating in a new domestic “Buy” signal taking effect May 20, 2025.
Concurrently, our International Trend Tracking Index (TTI) experienced parallel volatility. On April 4, 2025, it breached critical thresholds, prompting a “Sell” recommendation. This position reversed as global markets recovered, with the International TTI regaining sufficient momentum to issue a new “Buy” signal effective May 8, 2025.
3. Trend Tracking Indexes (TTIs)
Bullish vibes were nowhere to be found—the bears took full control from the open and drove everything deep into the red.
Stocks, bonds, crypto… you name it, it got hit hard. There was really no place to hide, and even the metals took a solid licking, unable to buck the trend like they often do.
Our TTIs couldn’t escape the pressure either—they gave back some of their recent gains, with both pulling lower.
The domestic one is now getting uncomfortably close to its long-term trend line and risks breaking below it, which would end the current Buy cycle. The international TTI held up a little better but still retreated.
This is how we closed 03/18/2026:
Domestic TTI: +1.80% above its M/A (prior close +3.16%)—Buy signal effective 5/20/25.
International TTI: +4.78% above its M/A (prior close +5.83%)—Buy signal effective 5/8/25.
All linked charts above are courtesy of Bloomberg via ZeroHedge.
———————————————————-
WOULD YOU LIKE TO HAVE YOUR INVESTMENTS PROFESSIONALLY MANAGED?
Do you have the time to follow our investment plans yourself? If you are a busy professional who would like to have his portfolio managed using our methodology, please contact me directly to get more details.
Contact Ulli