
- Moving the market
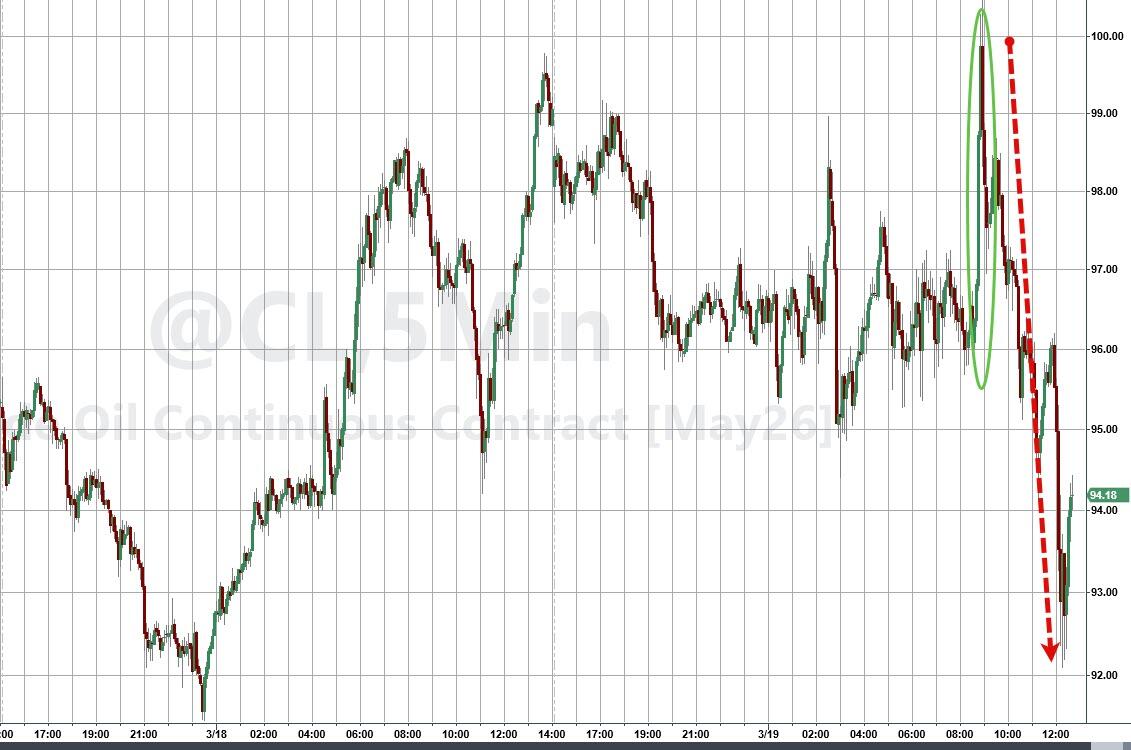
The major indexes opened weak and stayed under pressure for most of the day, as oil prices kept climbing on fresh worries from the U.S.-Iran conflict.
West Texas Intermediate crude swung between $93 and $100 a barrel, while Brent surged 3% to $111 after Iran struck a key LNG export facility in Qatar and Israel hit Iran’s South Pars gas field.
Iran retaliated by targeting Qatari energy sites, and President Trump warned that any more attacks on Qatar would lead to the U.S. “massively blowing up” the South Pars field.
One analyst summed it up: the U.S. and Israel have “won” the conventional war, but there’s no quick military fix for reopening the Strait of Hormuz without ground troops—meaning diplomacy is the only real path back to normal supply.
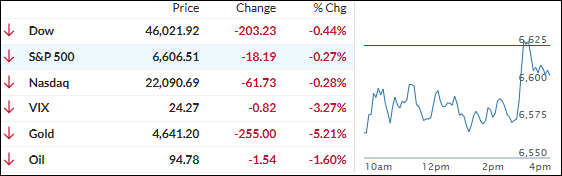
That energy shock kept the risk-off mood alive, with the S&P 500 and Dow closing lower (the S&P almost lost its 200-day moving average). The Nasdaq felt the tech weakness too.
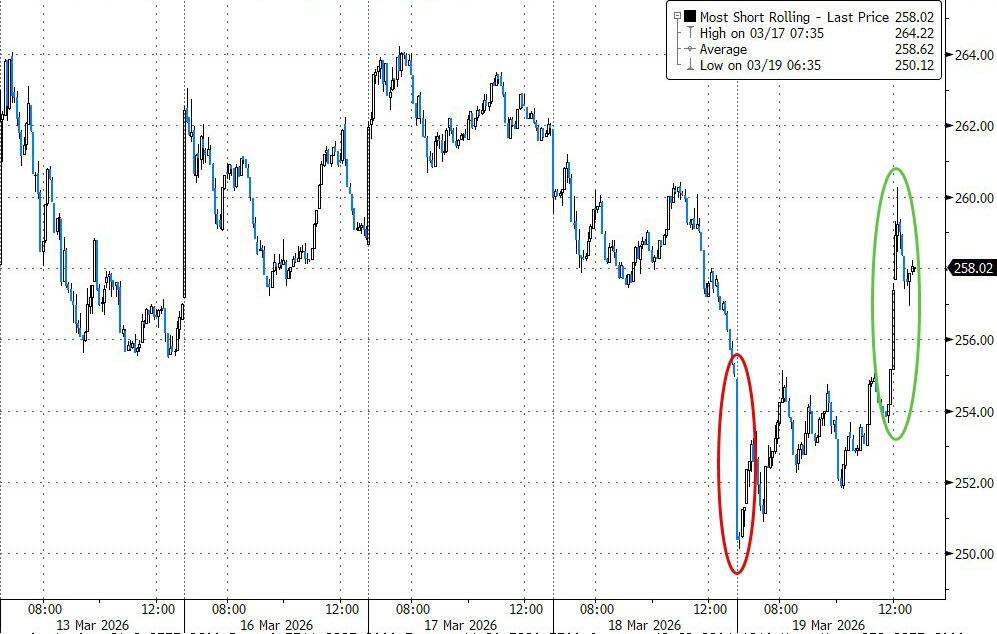
Small caps were the outlier, outperforming thanks to a big short squeeze that pushed them into the green.
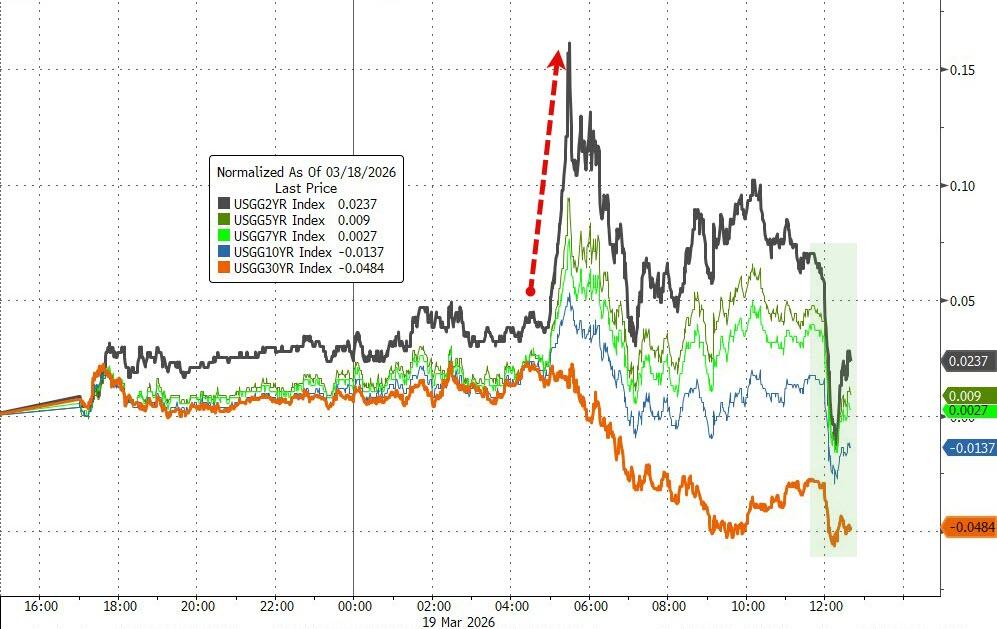
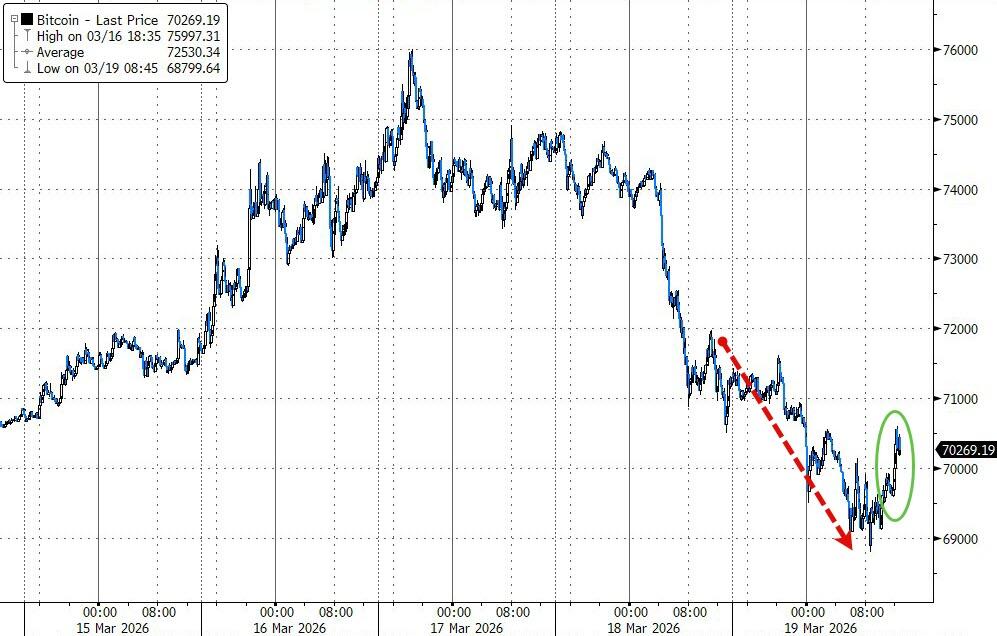
Bond yields surged midday but ended about flat, the dollar had an ugly day, gold got spanked again, and Bitcoin dipped but found support at $69K and popped into the close.
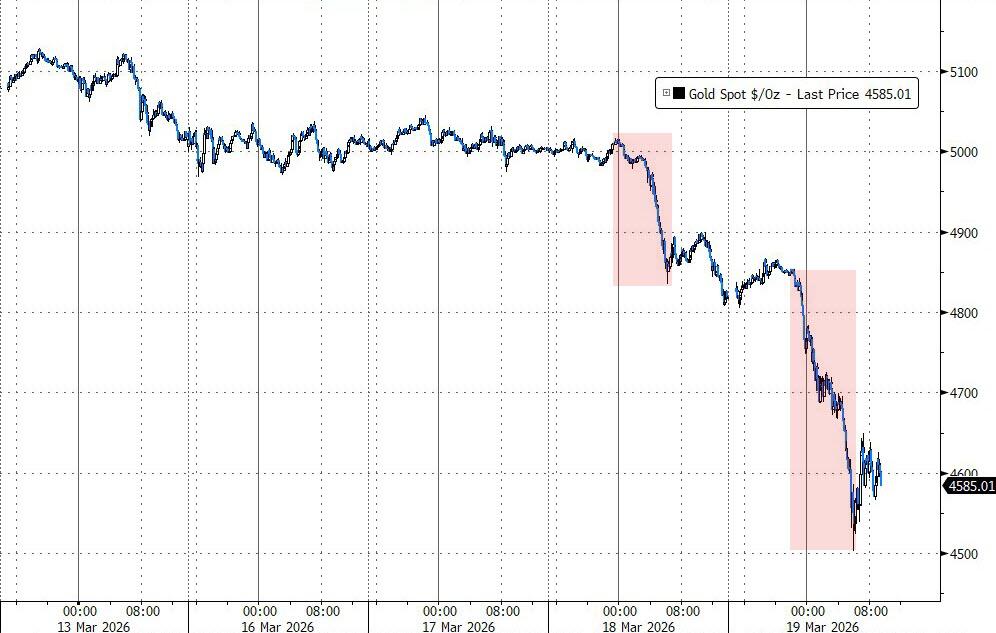
The metals complex is in a long-overdue correction after its huge run-up, but my long-term view remains bullish. The big legs lower in gold this week happened during Asia and Europe sessions, likely tied to strains in global dollar funding—if there’s a dollar shortage, gold gets sold first.
Big picture: the energy shock means higher inflation, slower growth, and a less accommodative Fed—unless a funding crisis forces emergency rate cuts.
Today’s weakness adds to the chop we’ve seen, but the underlying trend hasn’t broken yet.
2. Current domestic “Buy” Cycle (effective 5/20/2025); International “Buy” Cycle (effective 5/8/25)
Our domestic bullish cycle that began on November 21, 2023, concluded on April 3, 2025, following a market downturn triggered by President Trump’s tariff policy announcement.
This development caused significant declines across major indexes and broader market indices. However, markets subsequently rebounded, culminating in a new domestic “Buy” signal taking effect May 20, 2025.
Concurrently, our International Trend Tracking Index (TTI) experienced parallel volatility. On April 4, 2025, it breached critical thresholds, prompting a “Sell” recommendation. This position reversed as global markets recovered, with the International TTI regaining sufficient momentum to issue a new “Buy” signal effective May 8, 2025.
3. Trend Tracking Indexes (TTIs)
The bears stayed firmly in charge from start to finish, building on yesterday’s downside momentum and turning the tape into another full sea of red.
The major indexes had no real bounce in them today—steady selling pressure kept everything under water from open to close.
The metals complex got hit hard again, with gold taking its second meaningful drop this week.
Traders are pointing to the ongoing dollar funding crunch as the main culprit—when liquidity tightens and the dollar strengthens, hard assets often feel the pain.
Our TTIs followed the broader weakness too. The international one headed south with the market, while the domestic version fought back a bit harder and managed to close right around breakeven.
This is how we closed 03/19/2026:
Domestic TTI: +1.72% above its M/A (prior close +1.80%)—Buy signal effective 5/20/25.
International TTI: +4.05% above its M/A (prior close +4.78%)—Buy signal effective 5/8/25.
All linked charts above are courtesy of Bloomberg via ZeroHedge.
———————————————————-
WOULD YOU LIKE TO HAVE YOUR INVESTMENTS PROFESSIONALLY MANAGED?
Do you have the time to follow our investment plans yourself? If you are a busy professional who would like to have his portfolio managed using our methodology, please contact me directly to get more details.
Contact Ulli