
ETF Tracker StatSheet
You can view the latest version here.
OIL WHIPSAWS, S&P BREAKS LOWER AS RATE‑CUT HOPES FADE
- Moving the market
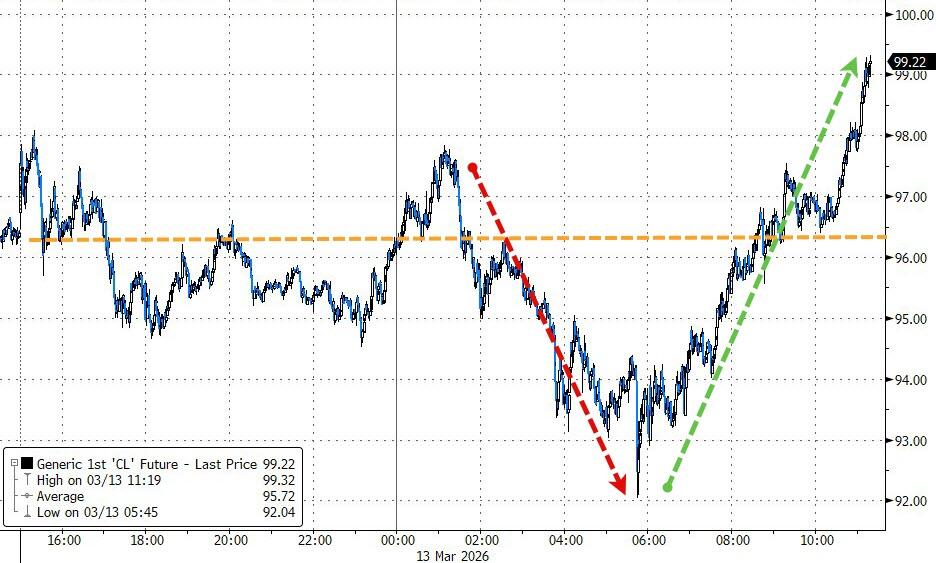
Oil’s recent spike finally ran out of steam today, with West Texas Intermediate hovering around 95 dollars and Brent holding near 100 after briefly closing above the triple‑digit mark for the first time since 2022.
Stocks were trying to find their footing after yesterday’s drop, when crude surged on comments from Iran’s new Supreme Leader that the Strait of Hormuz should stay shut as a pressure tactic in the ongoing conflict.
Today, Defense Secretary Pete Hegseth tried to calm nerves, saying the U.S. has been managing the shipping disruption and that “we don’t need to worry about it,” but traders aren’t fully convinced.
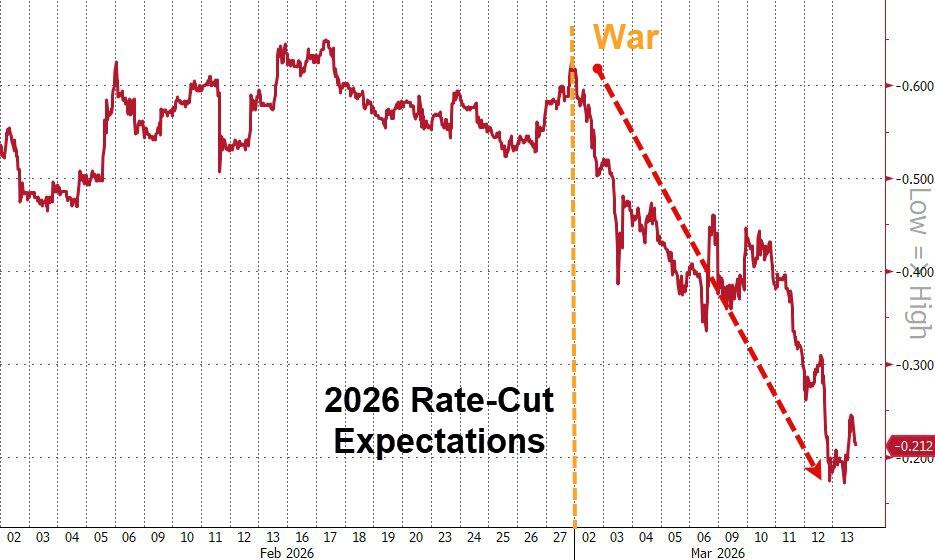
Higher oil prices, sticky inflation worries, and a string of weaker data have already pulled down expectations for Fed rate cuts this year, and the fourth‑quarter 2025 GDP revision to just 0.7% growth from 1.4% only reinforced the sense that the economy is slogging along under that weight.
By midday, oil had flipped the script again: WTI reversed early losses and closed higher, yanking what was left of the day’s positive tone out of the equity market as confidence in anyone’s oil-price forecasts basically evaporated.
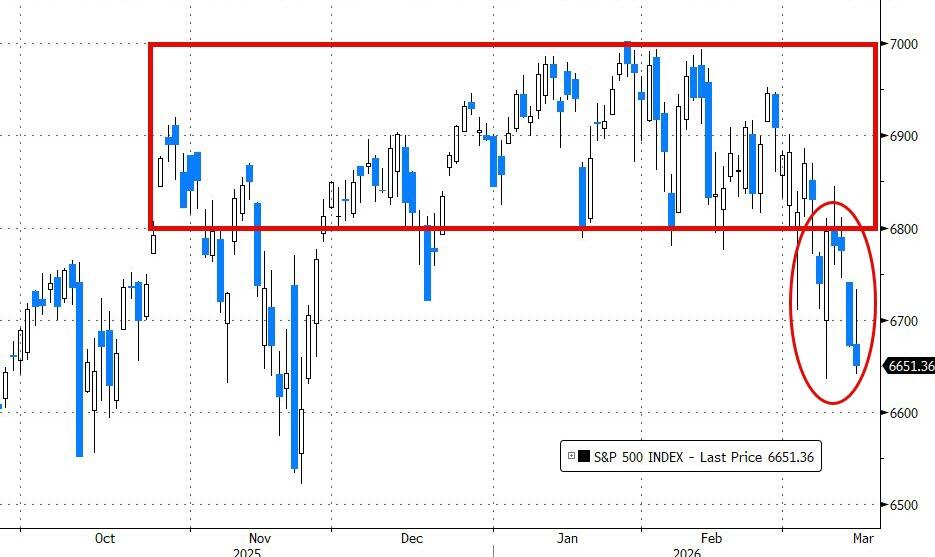
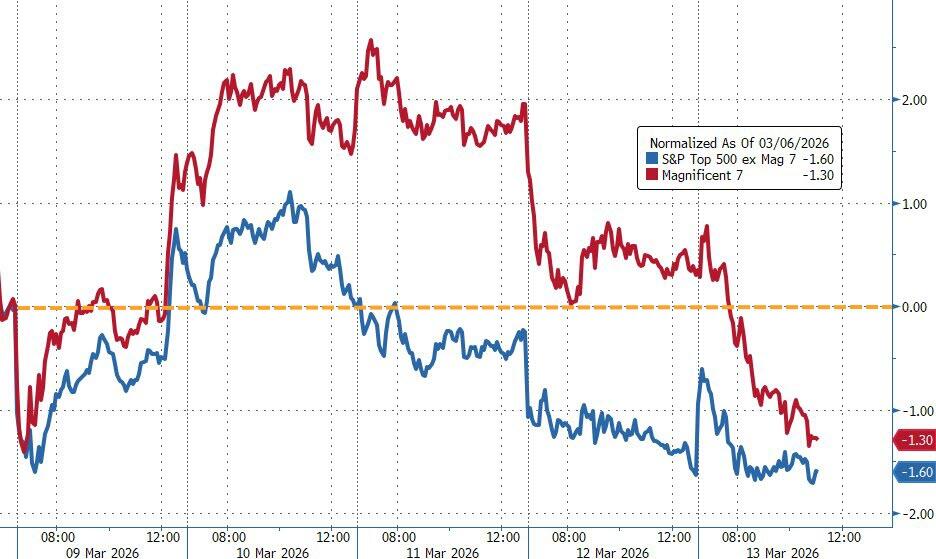
The S&P 500 broke down out of its recent trading range, and the Mag 7 cohort, which had looked like a relative safe haven for most of the week, finally gave way and slid alongside the other 493 names.
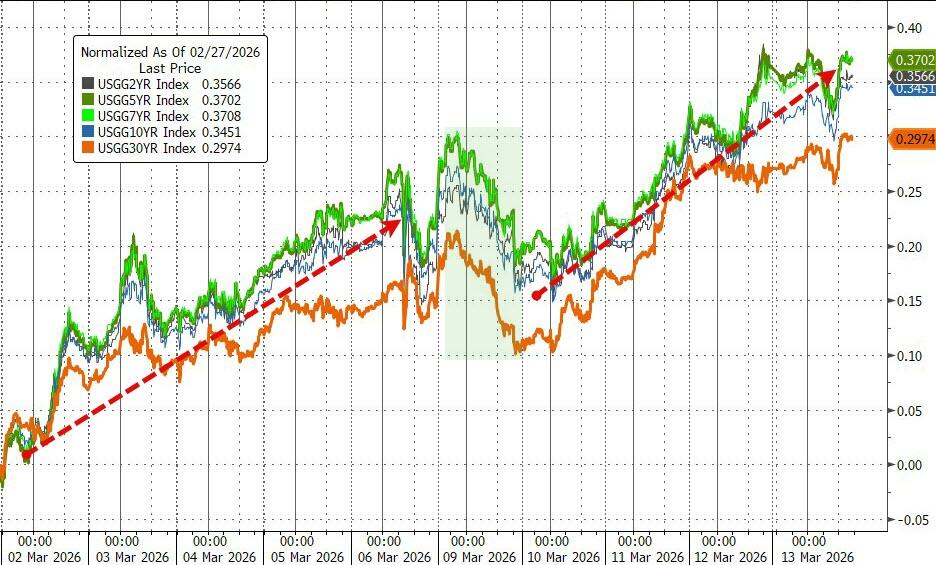
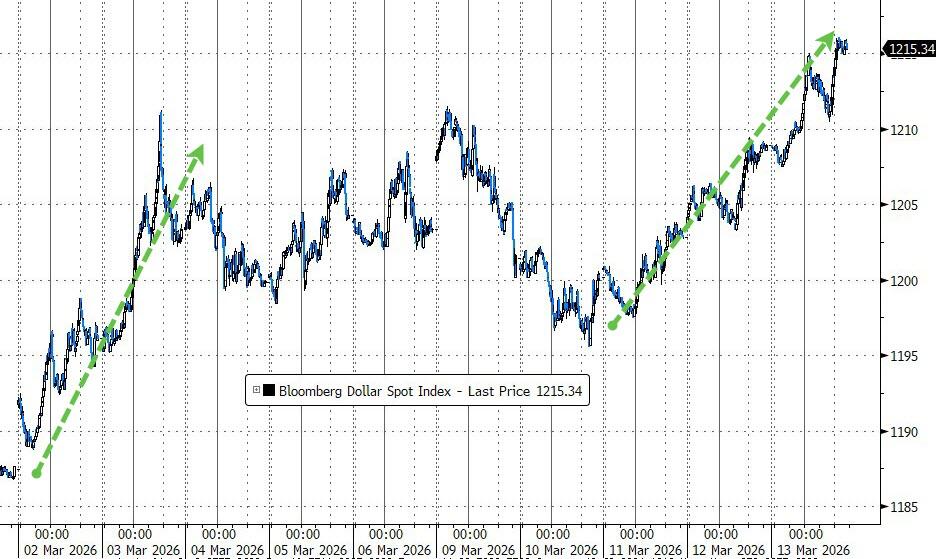
Bond yields offered no relief, surging sharply over the past two weeks as rate‑cut odds were slashed, helping keep the dollar in rally mode over the last three sessions.
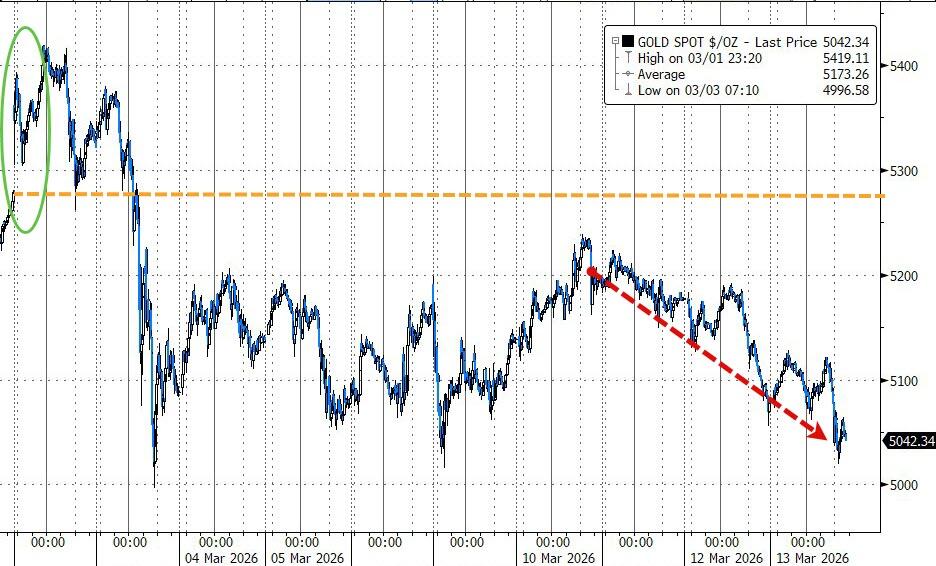
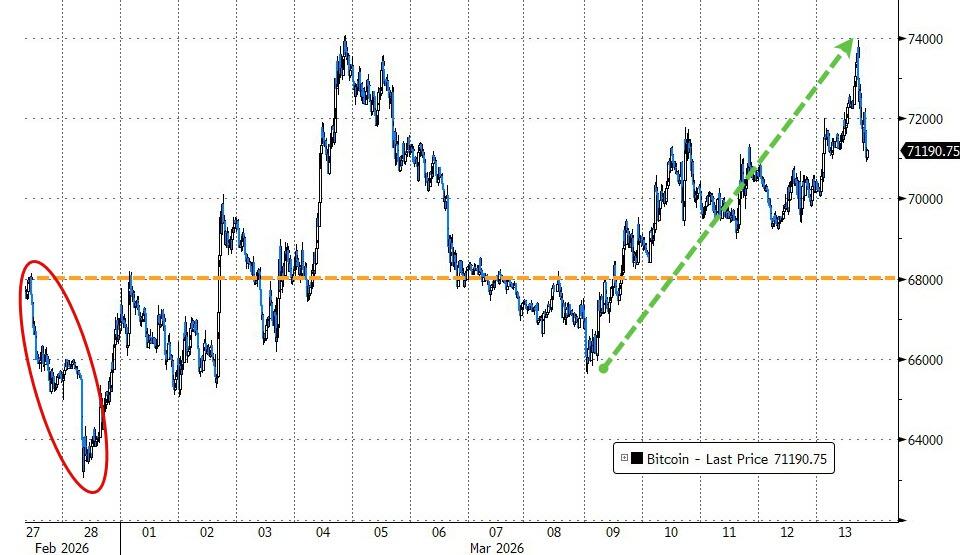
Gold has been swimming against that current but so far is holding the key $5,000 level, while Bitcoin pushed to new post‑war highs, briefly testing $74,000 before easing back.
Stepping back, equities are actually holding up better than you might expect given war headlines, a choppy economy, and wild action in oil.
The prevailing view on Wall Street seems to be that the oil shock is more of a temporary flare‑up than a permanent regime change: yes, it likely keeps inflation hotter in the near term and pushes out the timing of Fed cuts, but those cuts are still “later, not never” in most forecasts.
The real question is whether that patience will hold if oil stays elevated, and growth keeps cooling—or if markets finally lose their nerve and start pricing a tougher path ahead.
2. Current domestic “Buy” Cycle (effective 5/20/2025); International “Buy” Cycle (effective 5/8/25)
Our domestic bullish cycle that began on November 21, 2023, concluded on April 3, 2025, following a market downturn triggered by President Trump’s tariff policy announcement.
This development caused significant declines across major indexes and broader market indices. However, markets subsequently rebounded, culminating in a new domestic “Buy” signal taking effect May 20, 2025.
Concurrently, our International Trend Tracking Index (TTI) experienced parallel volatility. On April 4, 2025, it breached critical thresholds, prompting a “Sell” recommendation. This position reversed as global markets recovered, with the International TTI regaining sufficient momentum to issue a new “Buy” signal effective May 8, 2025.
3. Trend Tracking Indexes (TTIs)
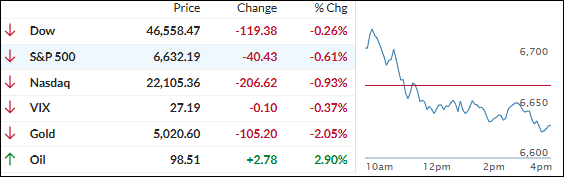
Stocks tried to bounce early but couldn’t hang on, as another wild swing in oil kept traders on edge.
Crude dumped and then ripped right back, and equities moved in reverse—after a positive open, the major indexes slid steadily and finished in the red, with the Nasdaq taking the biggest hit.
Metals slipped in sympathy with the risk-off tone, but Bitcoin went its own way and managed to notch a gain on the day.
Our TTIs were mixed, with the international index pulling back while the domestic one mostly moved sideways and held its ground.
This is how we closed 03/13/2026:
Domestic TTI: +1.83% above its M/A (prior close +2.08%)—Buy signal effective 5/20/25.
International TTI: +4.55% above its M/A (prior close +5.64%)—Buy signal effective 5/8/25.
All linked charts above are courtesy of Bloomberg via ZeroHedge.
———————————————————-
WOULD YOU LIKE TO HAVE YOUR INVESTMENTS PROFESSIONALLY MANAGED?
Do you have the time to follow our investment plans yourself? If you are a busy professional who would like to have his portfolio managed using our methodology, please contact me directly to get more details.
Contact Ulli