
- Moving the market
The day felt like the market was stuck in neutral—early trading was super quiet as everyone digested more signs the job market is cooling off.
The Challenger report showed U.S. companies have now announced over 1 million job cuts this year (blame restructuring, AI, and tariff worries), and yesterday’s weak ADP payrolls number added to the pile.
Traders basically shrugged at today’s weekly jobless claims hitting their lowest since September 2022 and focused on the big picture: the labor market is softening enough that a December Fed rate cut feels like a lock.
Markets are now pricing an 89% chance of a quarter-point cut next Wednesday—way up from just a couple weeks ago. That dovish vibe kept things calm, even though it was a choppy, directionless session overall.
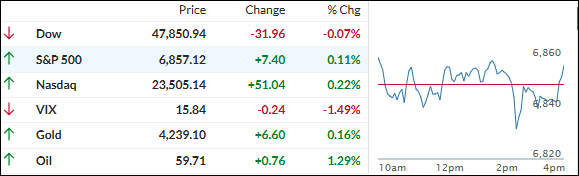
Small caps were the clear winners (short squeeze still in full swing), while the rest of the market just bounced around.
Bond yields crept higher, the dollar finished flat, gold squeaked out a tiny win and got back above $4,200, and bitcoin gave back some of its recent gains to settle around $92K.
On a brighter note, for wallets: average gas prices nationwide just dipped below $3.00/gallon for the first time since May 2021 (California folks… yeah, we’re still paying the premium).
Tomorrow, we get consumer sentiment, personal income/spending, and—most importantly—the September Core PCE number, the Fed’s favorite inflation gauge.
That one could actually move the needle.
2. Current domestic “Buy” Cycle (effective 5/20/2025); International “Buy” Cycle (effective 5/8/25)
Our domestic bullish cycle that began on November 21, 2023, concluded on April 3, 2025, following a market downturn triggered by President Trump’s tariff policy announcement.
This development caused significant declines across major indexes and broader market indices. However, markets subsequently rebounded, culminating in a new domestic “Buy” signal taking effect May 20, 2025.
Concurrently, our International Trend Tracking Index (TTI) experienced parallel volatility. On April 4, 2025, it breached critical thresholds, prompting a “Sell” recommendation. This position reversed as global markets recovered, with the International TTI regaining sufficient momentum to issue a new “Buy” signal effective May 8, 2025.
3. Trend Tracking Indexes (TTIs)
The major indexes basically spent the whole day glued to the flat line—like they couldn’t decide what to do.
In the end, the S&P 500 and Nasdaq snuck out tiny green closes thanks to a little buying spree right at the bell. The Dow? Pretty much dead even.
Our TTIs mostly just floated along with the market and went nowhere special. That said, the international one put in a bit more effort and finished with a respectable moderate gain.
This is how we closed 12/04/2025:
Domestic TTI: +6.43% above its M/A (prior close +6.40%)—Buy signal effective 5/20/25.
International TTI: +10.07% above its M/A (prior close +9.84%)—Buy signal effective 5/8/25.
All linked charts above are courtesy of Bloomberg via ZeroHedge.
———————————————————-
WOULD YOU LIKE TO HAVE YOUR INVESTMENTS PROFESSIONALLY MANAGED?
Do you have the time to follow our investment plans yourself? If you are a busy professional who would like to have his portfolio managed using our methodology, please contact me directly to get more details.
Contact Ulli