
ETF Tracker StatSheet
You can view the latest version here.
DOW LEADS WEEKLY GAINS AS TRADERS EYE FED, CHIP STOCKS STUMBLE
- Moving the market
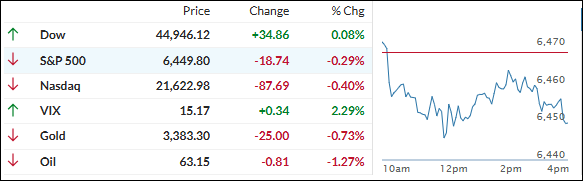
The S&P 500 dipped a bit on Friday after hitting fresh record highs, as traders took the chance to lock in some gains.
Still, it was a solid week across the board—the Dow led the pack, jumping 2%, while the S&P 500 and Nasdaq each notched more than 1% gains. Optimism over possible Fed rate cuts, fueled by tame inflation data, kept the mood upbeat despite some bumps.
Chip stocks and weak consumer sentiment poured a little cold water on the market today. Applied Materials slumped over 11%, dragging the semiconductor sector lower, and Nvidia slipped 1%.
On the economic front, the University of Michigan’s consumer sentiment index fell to 58.6—down from 61.7—as worries about inflation crept back in. Still, retail sales for July rose 0.5%, in line with expectations, showing the U.S. consumer is hanging in there.
Looking ahead, traders are betting the AI boom and hopes for Fed cuts can keep this rally alive, even as we head into the historically choppy waters of late summer. Whether that optimism pays off, especially with Fed Chair Powell’s Jackson Hole speech on deck next week, is anyone’s guess.
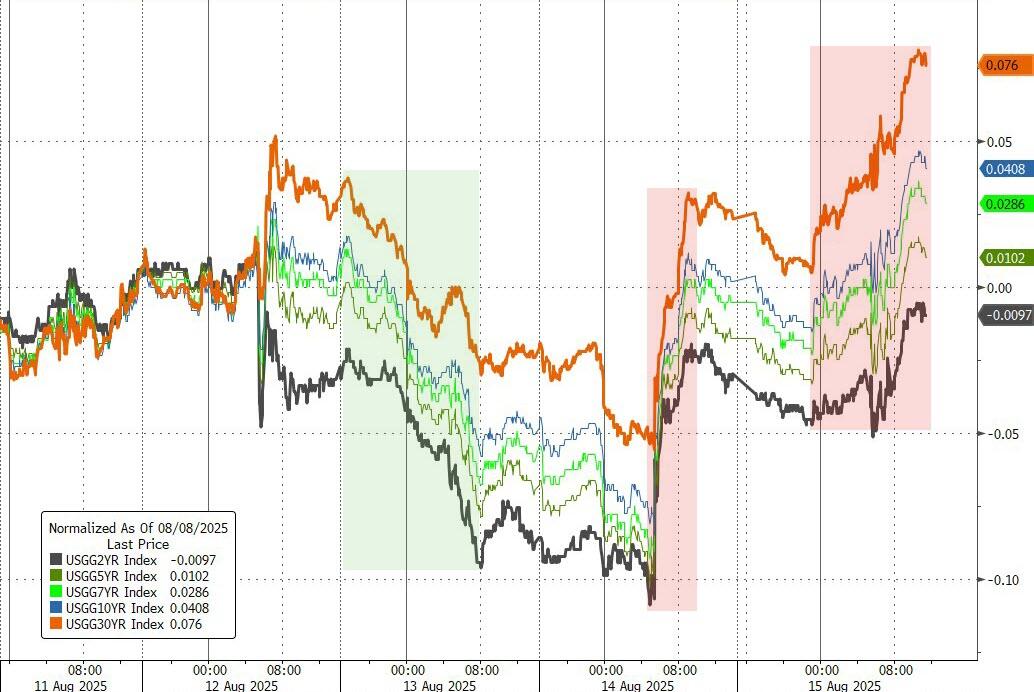
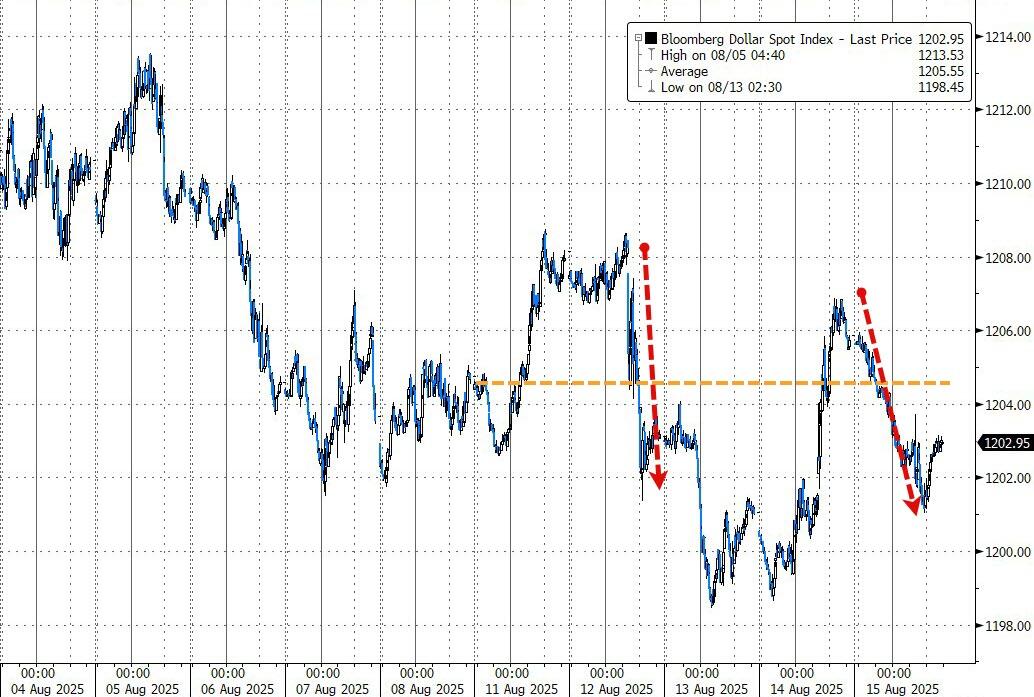
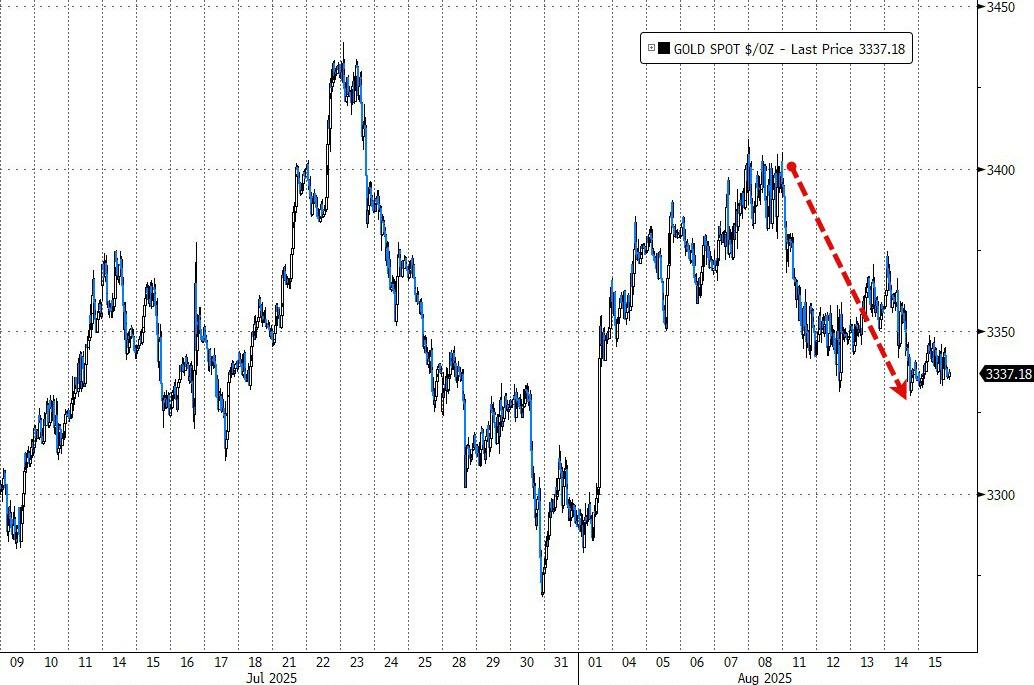
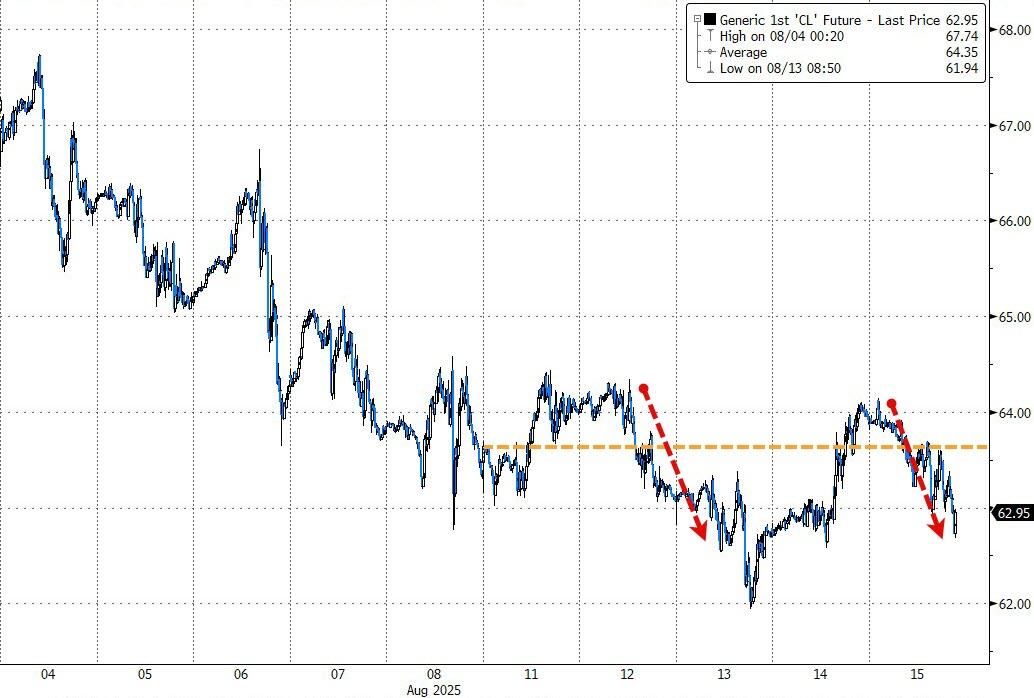
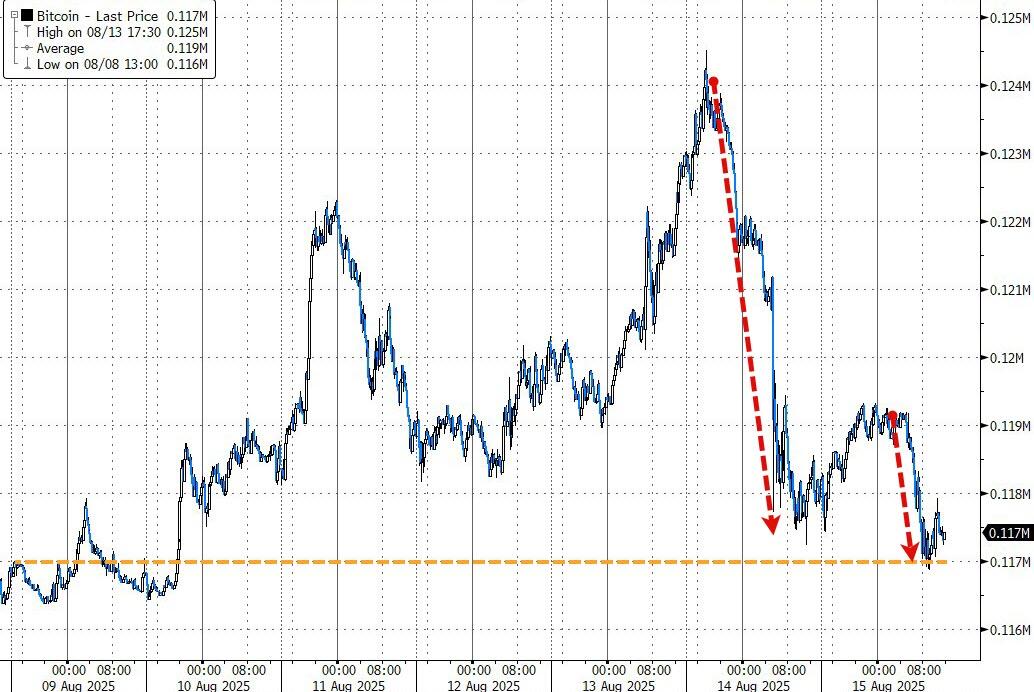
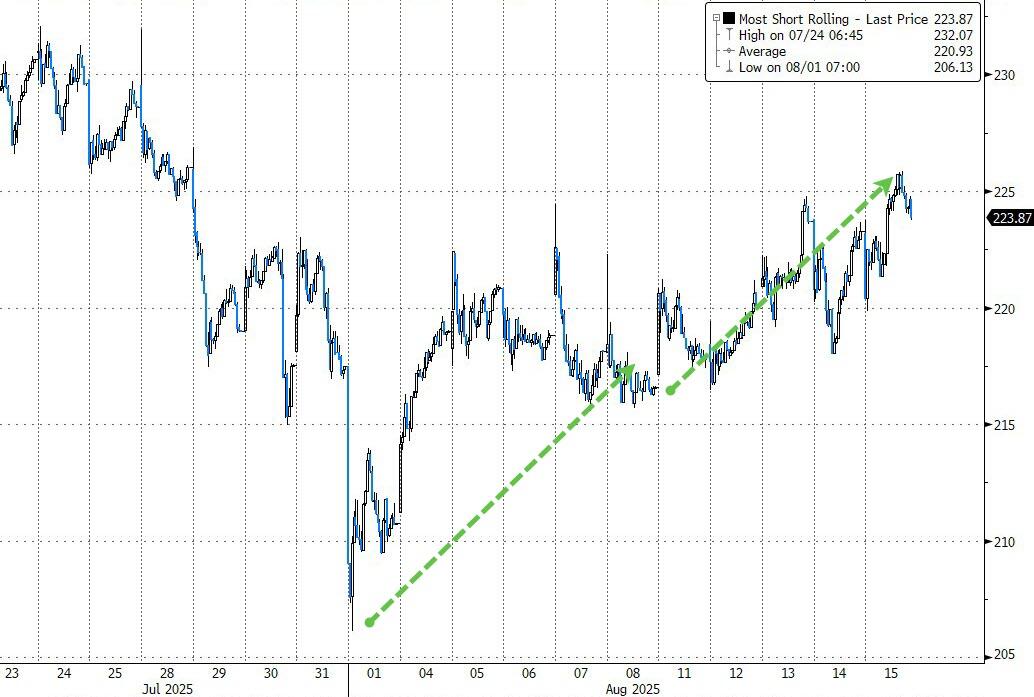
By the closing bell: stocks and bond yields finished higher, the dollar dipped slightly, gold took it on the chin, oil was flat, and bitcoin eased off after hitting new highs. Short sellers keep getting squeezed—11 weeks and counting for the “most shorted” stocks.
With the “dog days” of summer in full swing, will Powell’s speech at Jackson Hole set the next big move—or just add to the summer haze?
2. Current domestic “Buy” Cycle (effective 5/20/2025); International “Buy” Cycle (effective 5/8/25)
Our domestic bullish cycle that began on November 21, 2023, concluded on April 3, 2025, following a market downturn triggered by President Trump’s tariff policy announcement.
This development caused significant declines across major indexes and broader market indices. However, markets subsequently rebounded, culminating in a new domestic “Buy” signal taking effect May 20, 2025.
Concurrently, our International Trend Tracking Index (TTI) experienced parallel volatility. On April 4, 2025, it breached critical thresholds, prompting a “Sell” recommendation. This position reversed as global markets recovered, with the International TTI regaining sufficient momentum to issue a new “Buy” signal effective May 8, 2025.
3. Trend Tracking Indexes (TTIs)
You could sum up today’s session in one word: sluggish.
The major indexes just drifted along, with only the Dow squeezing out a small gain while the others went nowhere.
Our TTIs went their separate ways again—the international TTI held steady, while the domestic one slipped a bit. Both changes were pretty minor.
This is how we closed 08/15/2025:
Domestic TTI: +5.15% above its M/A (prior close +5.52%)—Buy signal effective 5/20/25.
International TTI: +10.31% above its M/A (prior close +10.32%)—Buy signal effective 5/8/25.
All linked charts above are courtesy of Bloomberg via ZeroHedge.
———————————————————-
WOULD YOU LIKE TO HAVE YOUR INVESTMENTS PROFESSIONALLY MANAGED?
Do you have the time to follow our investment plans yourself? If you are a busy professional who would like to have his portfolio managed using our methodology, please contact me directly to get more details.
Contact Ulli