
ETF Tracker StatSheet
You can view the latest version here.
GOLD SHINES AMID MARKET ROUT; NASDAQ ENDURES ROUGHEST WEEK IN MONTHS
- Moving the market
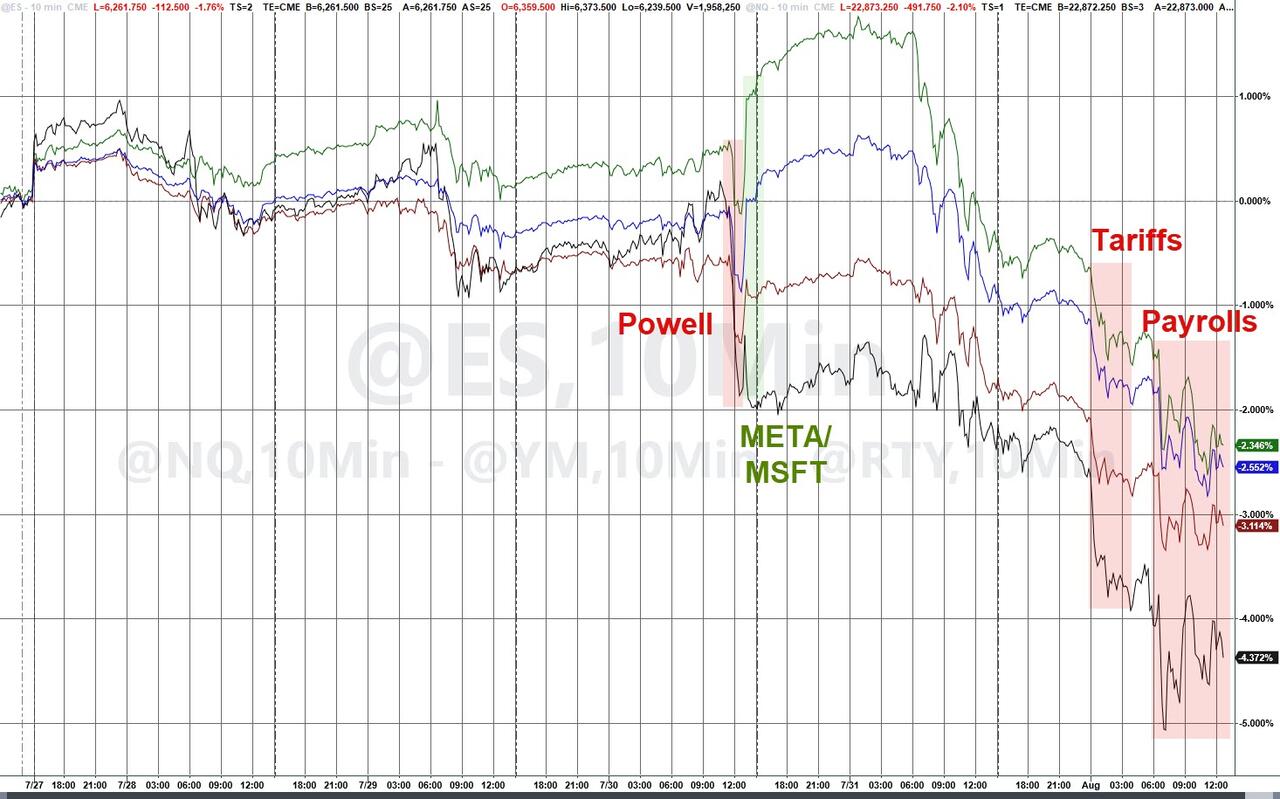
Stocks felt the heat on Friday as August trading kicked off with a double dose of bad news—a soft jobs report and President Trump’s new tariff hikes.
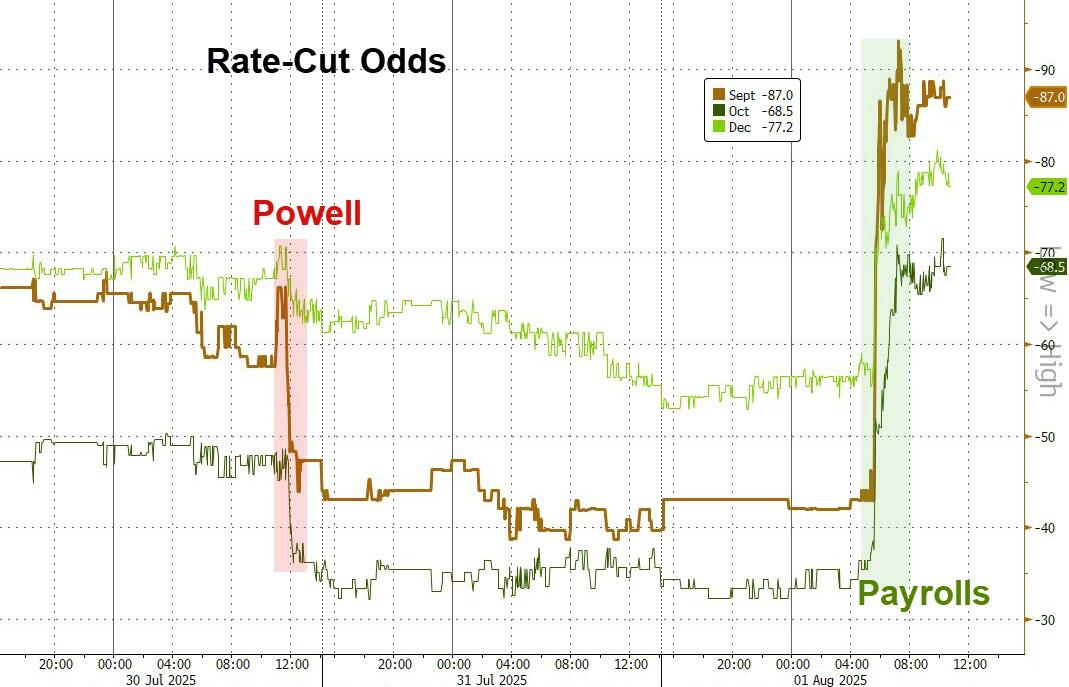
Nonfarm payrolls rose by just 73,000 last month, falling well short of the 100,000 jobs economists were expecting. To make matters worse, job growth for May and June was revised down sharply, signaling that the labor market’s been weaker for a while now.
Financial stocks took the brunt of it, with banks like JPMorgan Chase tumbling about 4% and Bank of America and Wells Fargo down more than 3%—all on fears that a slowing economy could squash loan growth.
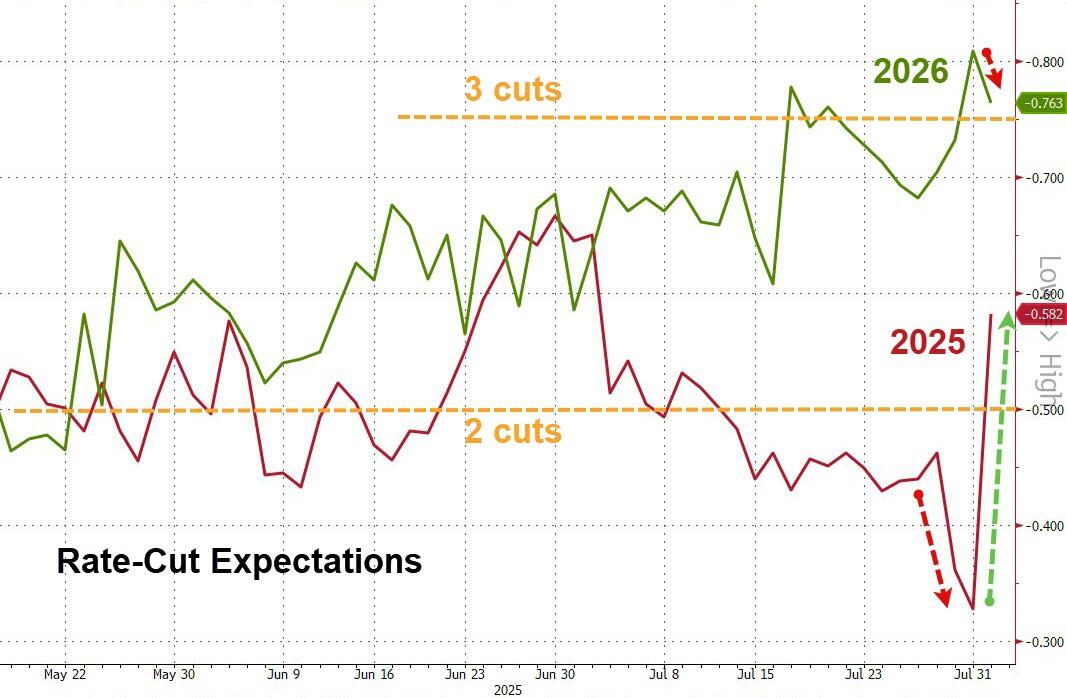
The grim data spiked odds that the Fed might cut rates sooner to give the economy a boost, with traders now pricing in a 66% chance of a rate cut by September.
Meanwhile, Trump’s updated tariffs—ranging anywhere from 10% to 41% on dozens of trading partners—hit overnight, stoking new trade war worries and adding to market jitters.
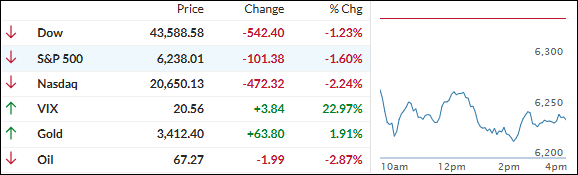
By the end of the first week of August, all the major indexes were in the red, especially Small Caps, with the Nasdaq holding up the best (though still suffering its biggest weekly loss in over two months).
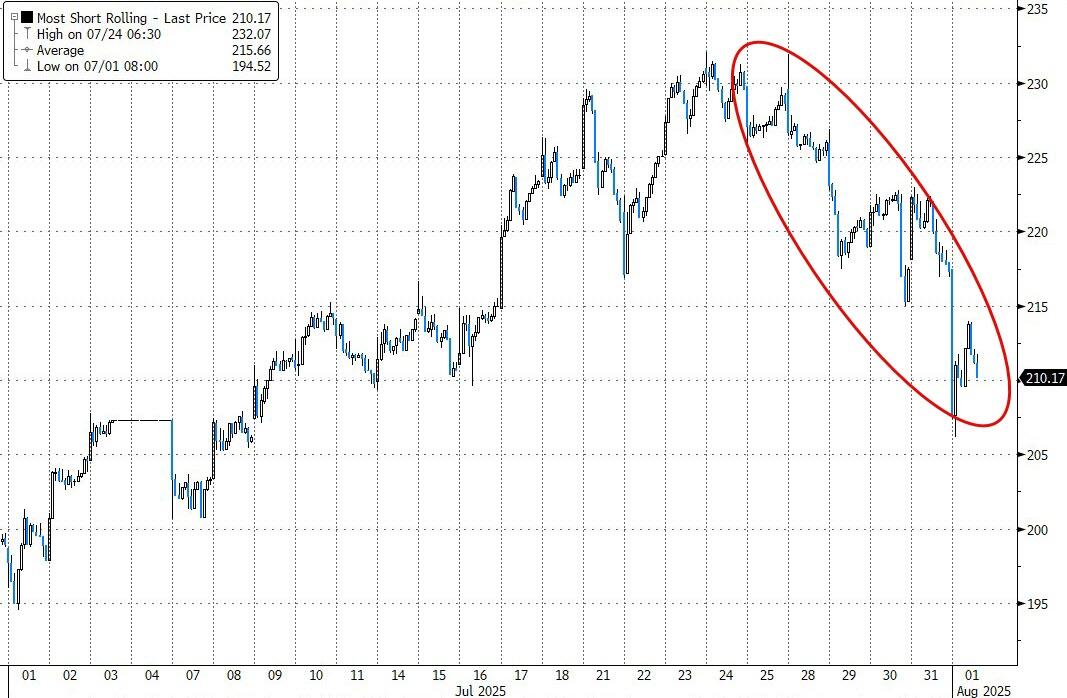
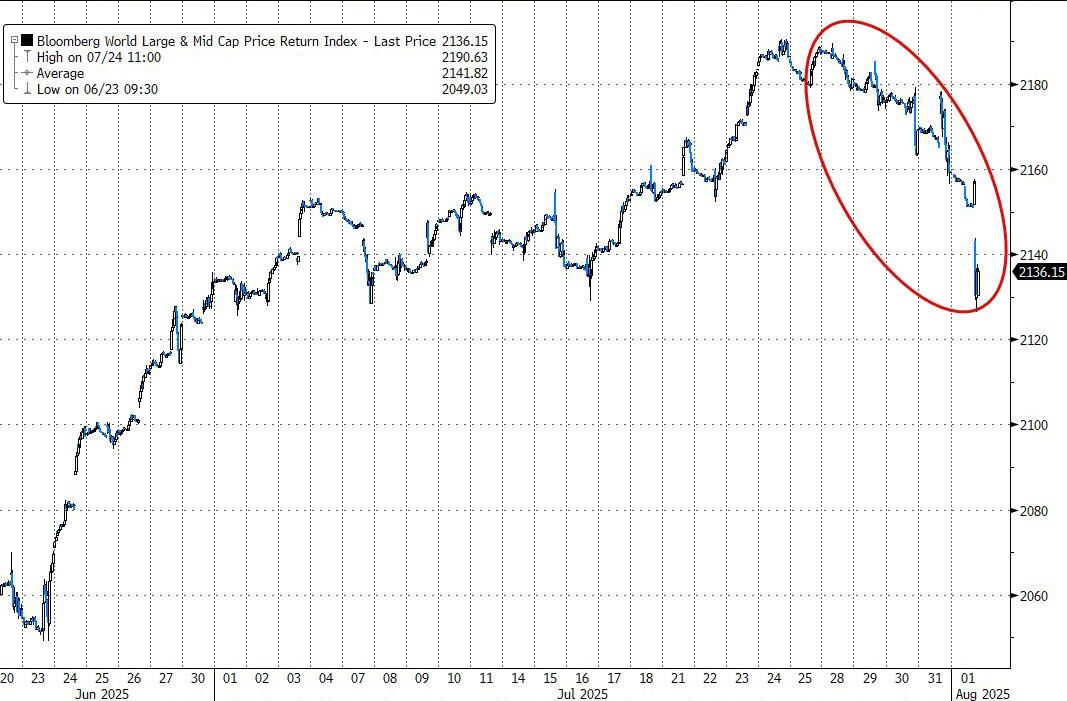
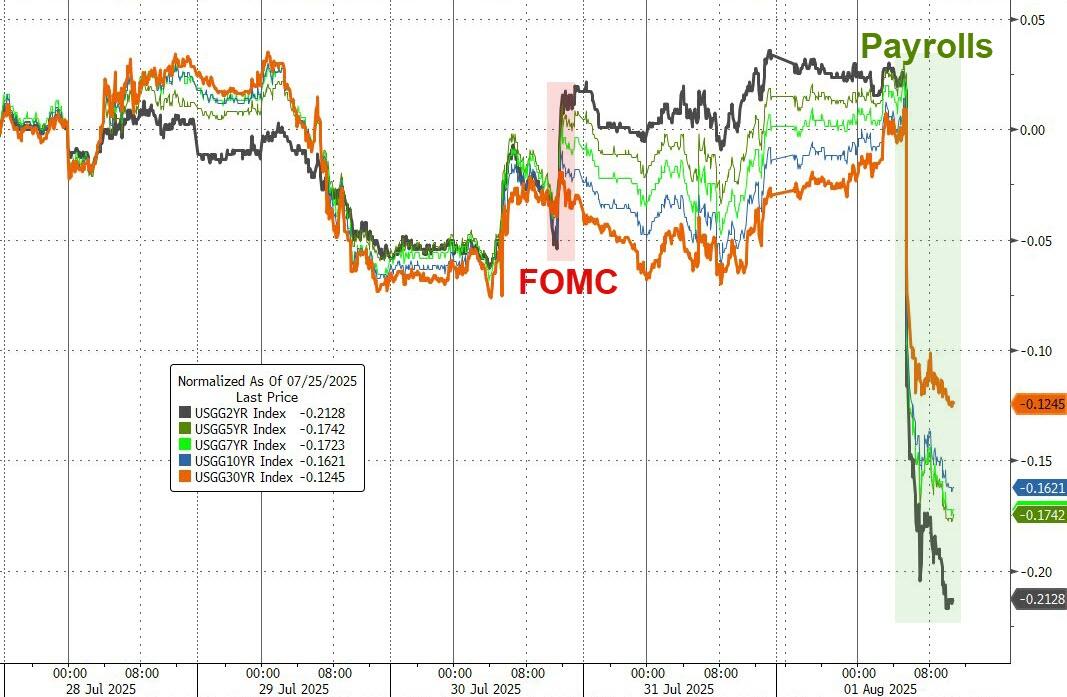
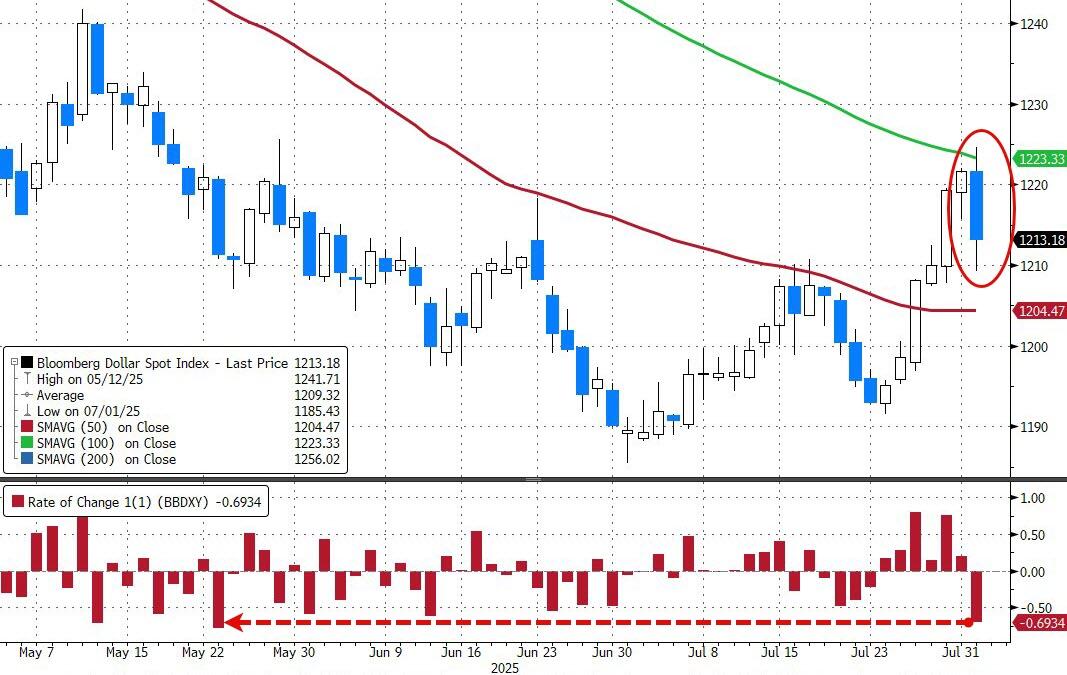
Trend-wise, the most shorted stocks have been down for seven straight days, global stock markets posted a sixth day of losses, bond yields collapsed, and the dollar broke its six-day winning streak with its worst session in two months.
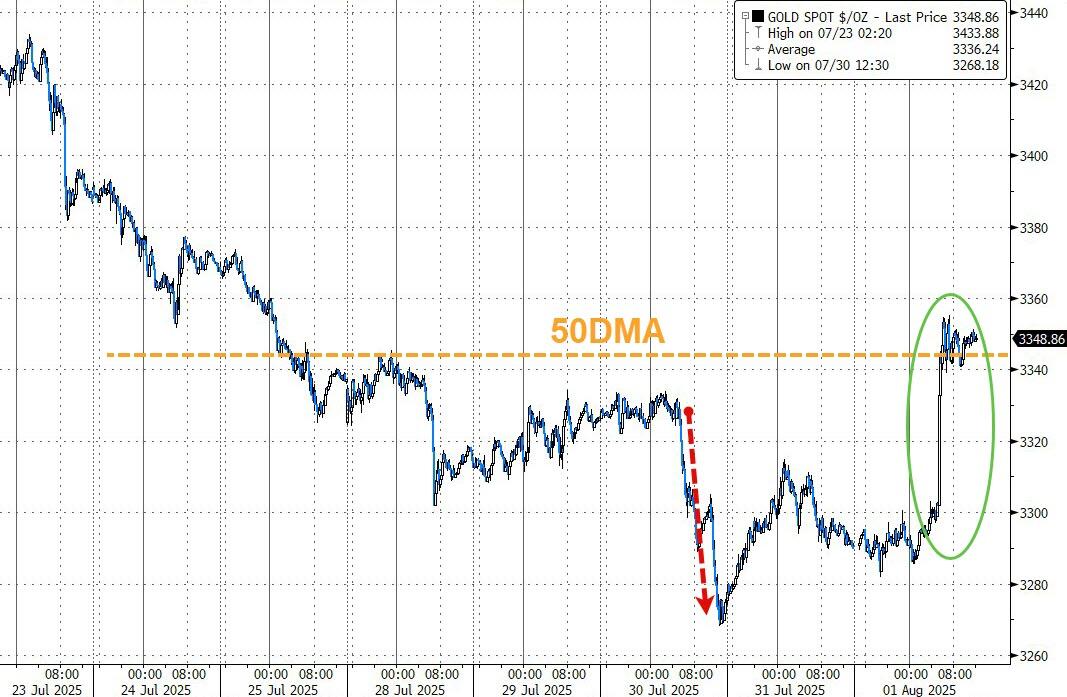
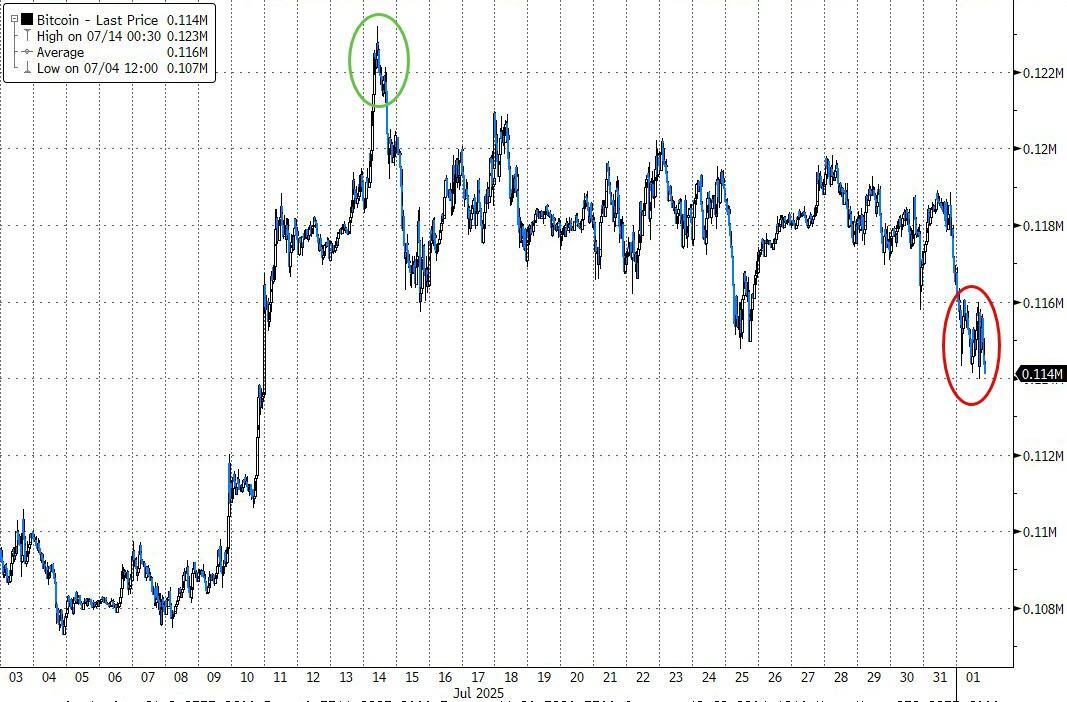
The only real bright spot was gold, which surged higher and locked in its best day in two months as nervous investors went searching for safety. Bitcoin had no such luck, slumping to its lowest level in three weeks.
So, here’s the real question: Will this weak jobs report turn out to be that “bad news is good news” twist for stocks—by pressuring the Fed into an earlier rate cut—or is there more pain ahead for the markets?
2. Current domestic “Buy” Cycle (effective 5/20/2025); International “Buy” Cycle (effective 5/8/25)
Our domestic bullish cycle that began on November 21, 2023, concluded on April 3, 2025, following a market downturn triggered by President Trump’s tariff policy announcement.
This development caused significant declines across major indexes and broader market indices. However, markets subsequently rebounded, culminating in a new domestic “Buy” signal taking effect May 20, 2025.
Concurrently, our International Trend Tracking Index (TTI) experienced parallel volatility. On April 4, 2025, it breached critical thresholds, prompting a “Sell” recommendation. This position reversed as global markets recovered, with the International TTI regaining sufficient momentum to issue a new “Buy” signal effective May 8, 2025.
3. Trend Tracking Indexes (TTIs)
Stocks got off to a rough start today, as a disappointing jobs report rattled the market and sent the bulls running for cover.
The bears took control right out of the gate and kept up the pressure all session long, leaving all the major indexes in the red by the close—especially the Nasdaq, which took the biggest hit.
Our TTIs also pulled back, but they’re still holding above their respective trend lines, so we’re still in bullish territory for now.
This is how we closed 08/01/2025:
Domestic TTI: +2.84% above its M/A (prior close +4.13%)—Buy signal effective 5/20/25.
International TTI: +6.17% above its M/A (prior close +7.18%)—Buy signal effective 5/8/25.
All linked charts above are courtesy of Bloomberg via ZeroHedge.
———————————————————-
WOULD YOU LIKE TO HAVE YOUR INVESTMENTS PROFESSIONALLY MANAGED?
Do you have the time to follow our investment plans yourself? If you are a busy professional who would like to have his portfolio managed using our methodology, please contact me directly to get more details.
Contact Ulli