
ETF Tracker StatSheet
You can view the latest version here.
MARKET RALLIES INTO WEEK’S END, BUT EU TRADE DEADLINE STILL LOOMS
- Moving the market
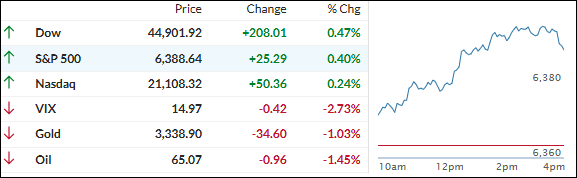
The major indexes kicked off the final trading day of the week on a high note, looking set to close out with solid gains. The S&P 500 led the way, while Small Caps and the Nasdaq lagged a bit.
Thursday marked the S&P 500’s 13th record close of the year—and impressively, four of those records came just this week. The Nasdaq wasn’t far behind, notching three new all-time highs of its own.
A strong earnings season has been a real boost, especially thanks to standout reports from Alphabet and Verizon, whose shares jumped 4% and 5% for the week. As of now, over 82% of the 169 S&P 500 companies reporting have topped Wall Street’s expectations—a stat that’s fueling even more optimism.
The fundamentals are pretty friendly for bulls right now: inflation is steady, interest rates are staying in their range, and corporate earnings are showing a solid uptrend. Add to that some recent progress on trade agreements—including with Japan—and the market mood has definitely brightened.
The one big question mark is whether the U.S. can hammer out a deal with the European Union before the August 1 deadline. That remains the market’s biggest unknown, but optimism is still holding up.
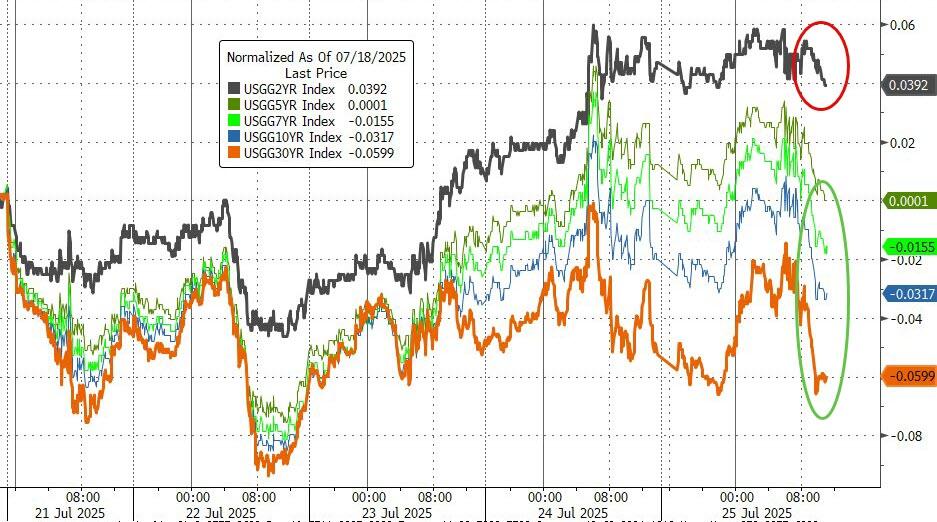
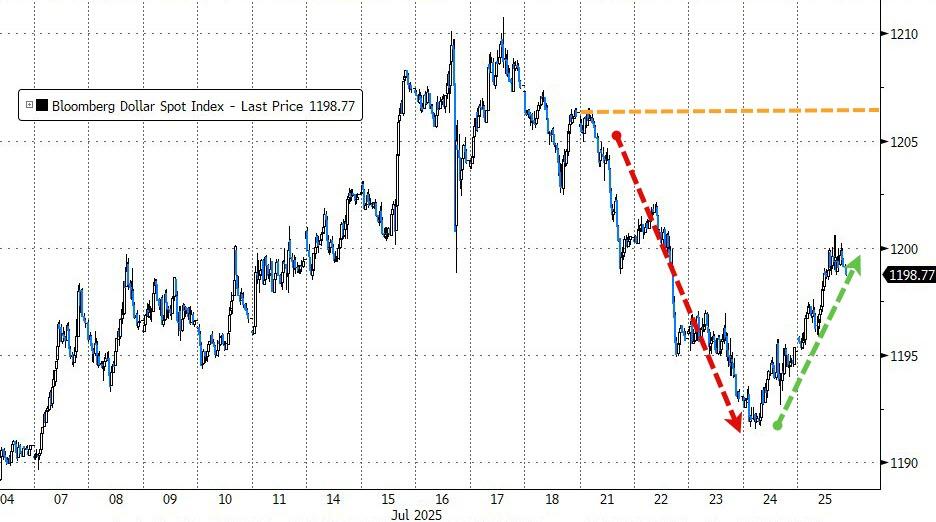
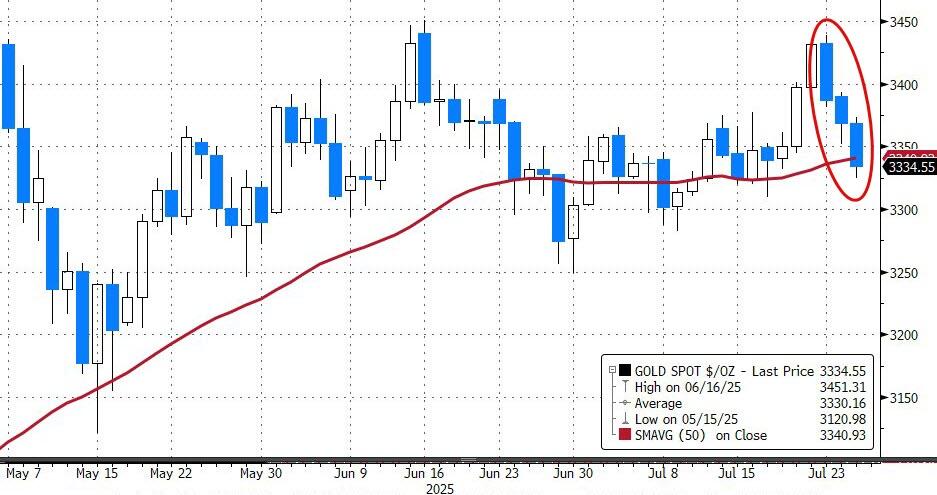
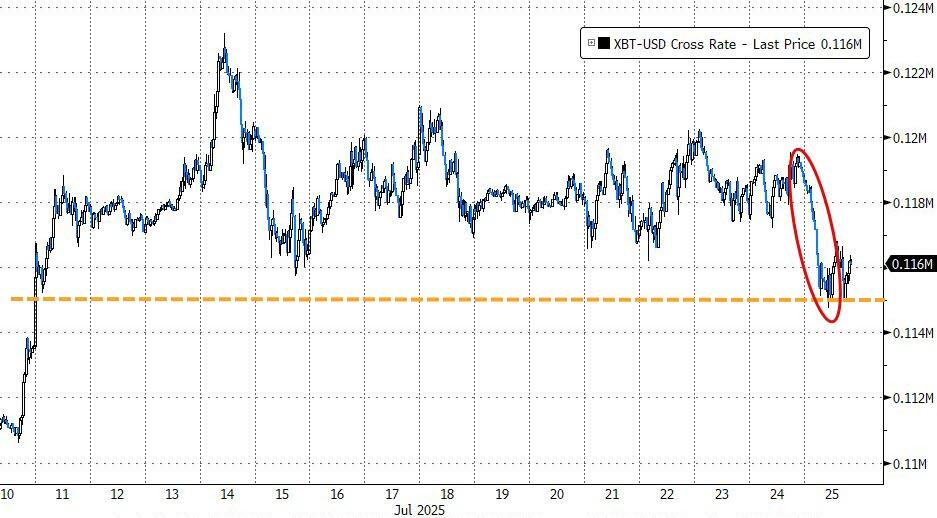
For the week, bond yields were mixed, the dollar regained some ground, gold slid for the third day in a row, and Bitcoin continued a two-week slide.
With so much going right for the bulls but that EU trade deadline still looming, I am pondering whether the good vibes will keep rolling—or could if the unresolved trade talks will trip up this rally?
2. Current domestic “Buy” Cycle (effective 5/20/2025); International “Buy” Cycle (effective 5/8/25)
Our domestic bullish cycle that began on November 21, 2023, concluded on April 3, 2025, following a market downturn triggered by President Trump’s tariff policy announcement.
This development caused significant declines across major indexes and broader market indices. However, markets subsequently rebounded, culminating in a new domestic “Buy” signal taking effect May 20, 2025.
Concurrently, our International Trend Tracking Index (TTI) experienced parallel volatility. On April 4, 2025, it breached critical thresholds, prompting a “Sell” recommendation. This position reversed as global markets recovered, with the International TTI regaining sufficient momentum to issue a new “Buy” signal effective May 8, 2025.
3. Trend Tracking Indexes (TTIs)
The market kicked off on a strong note and kept that momentum going, with all the major indexes finishing higher—up about 1% for the week.
A lot of the upbeat mood can be chalked up to growing optimism around ongoing trade deals.
Our TTIs told a mixed story, though: the domestic TTI managed a small gain, while the international one slipped a bit.
This is how we closed 07/25/2025:
Domestic TTI: +6.45% above its M/A (prior close +6.12%)—Buy signal effective 5/20/25.
International TTI: +9.75% above its M/A (prior close +10.39%)—Buy signal effective 5/8/25.
All linked charts above are courtesy of Bloomberg via ZeroHedge.
———————————————————-
WOULD YOU LIKE TO HAVE YOUR INVESTMENTS PROFESSIONALLY MANAGED?
Do you have the time to follow our investment plans yourself? If you are a busy professional who would like to have his portfolio managed using our methodology, please contact me directly to get more details.
Contact Ulli