
- Moving the market
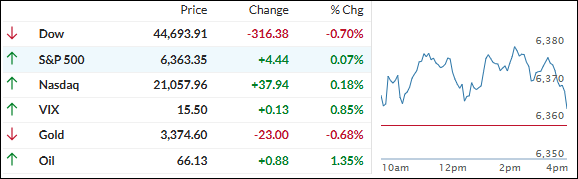
It was a turnaround kind of day for the markets. The S&P 500 and Nasdaq started strong—both riding early gains—while the Dow lagged, dragged down by IBM’s 10% tumble after missing revenue targets.
Big moves from the tech giants shaped the action: Alphabet popped 2% after beating Q2 revenue estimates, giving a boost to both the S&P and Nasdaq. Tesla, on the other hand, dropped 7% as auto sales disappointed for the second quarter in a row, putting a lid on broader index gains.
Traders also kept one eye on the ongoing standoff between Trump and the Fed. With Trump set to visit the Fed tomorrow, the tension is ramping up, especially as he keeps the pressure on Chairman Powell.
Helping sentiment this morning was a Financial Times report—confirmed by Bloomberg—that the U.S. is nearing a trade deal with the EU, which could see tariffs on imports climb to 15%.
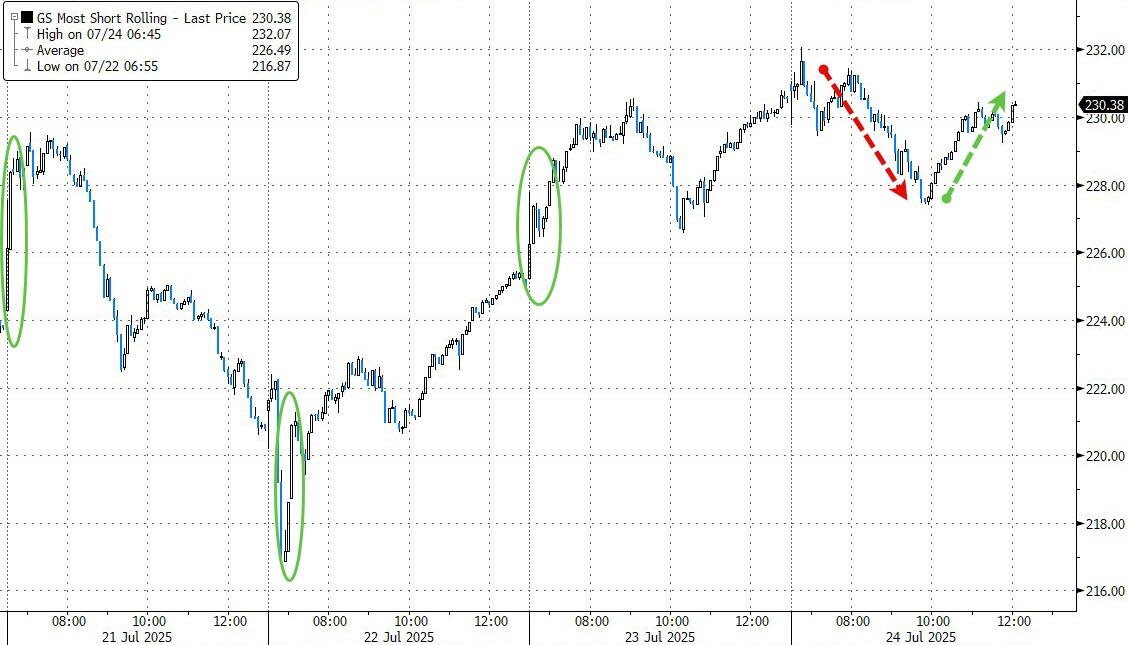
As the day wore on, enthusiasm fizzled. A midday short squeeze gave the indexes a quick lift, but only the S&P 500 and Nasdaq managed to eke out slim gains.
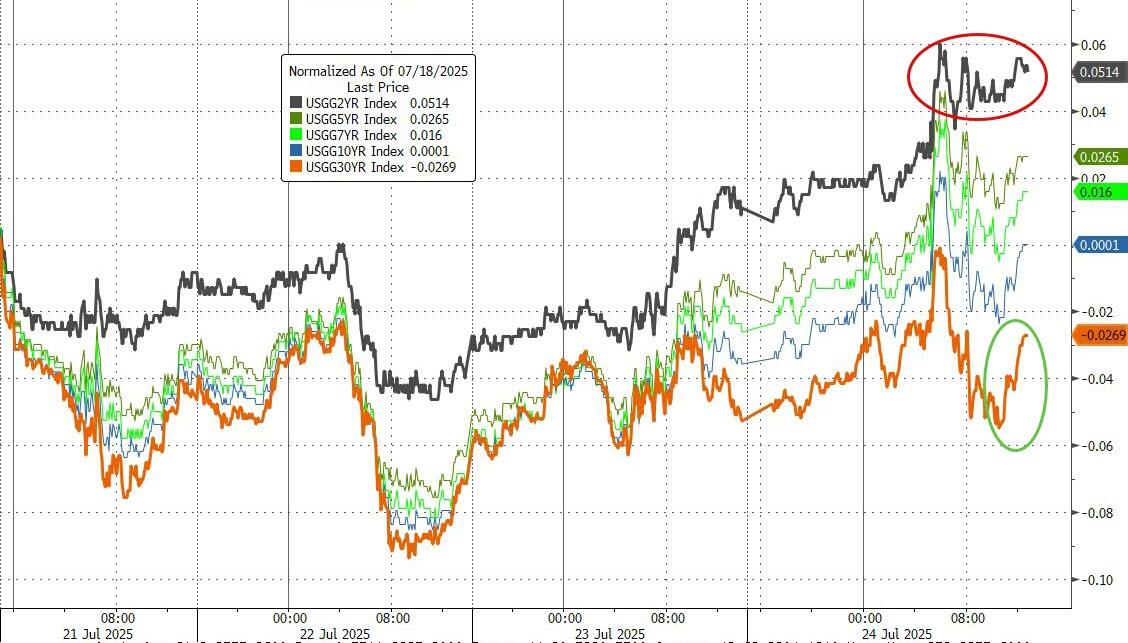
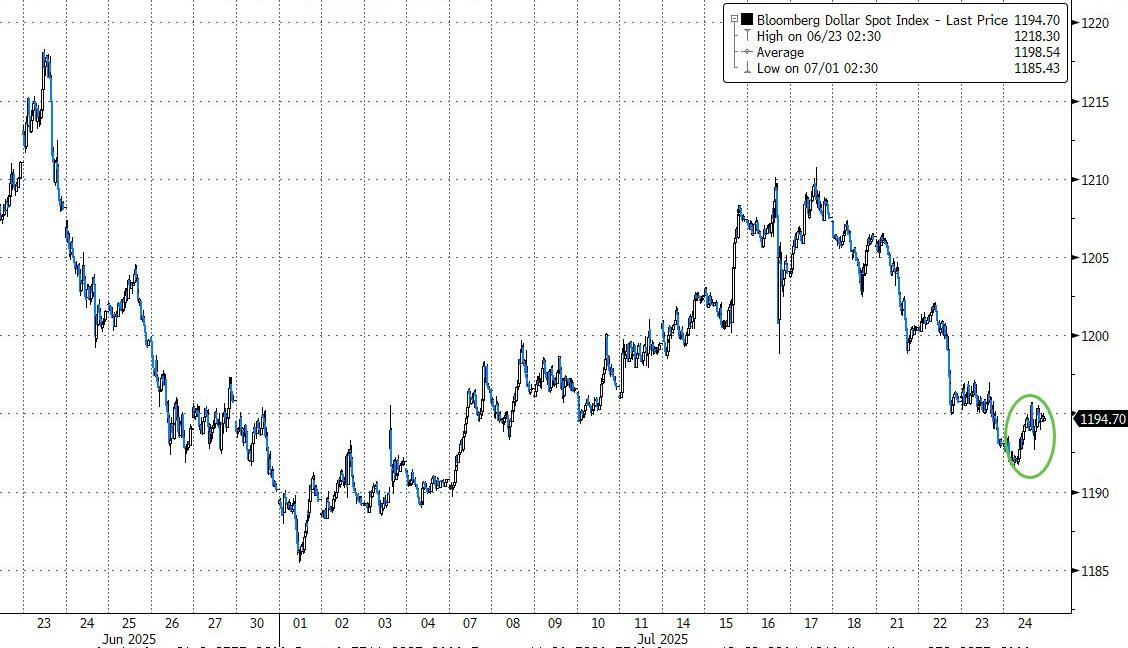
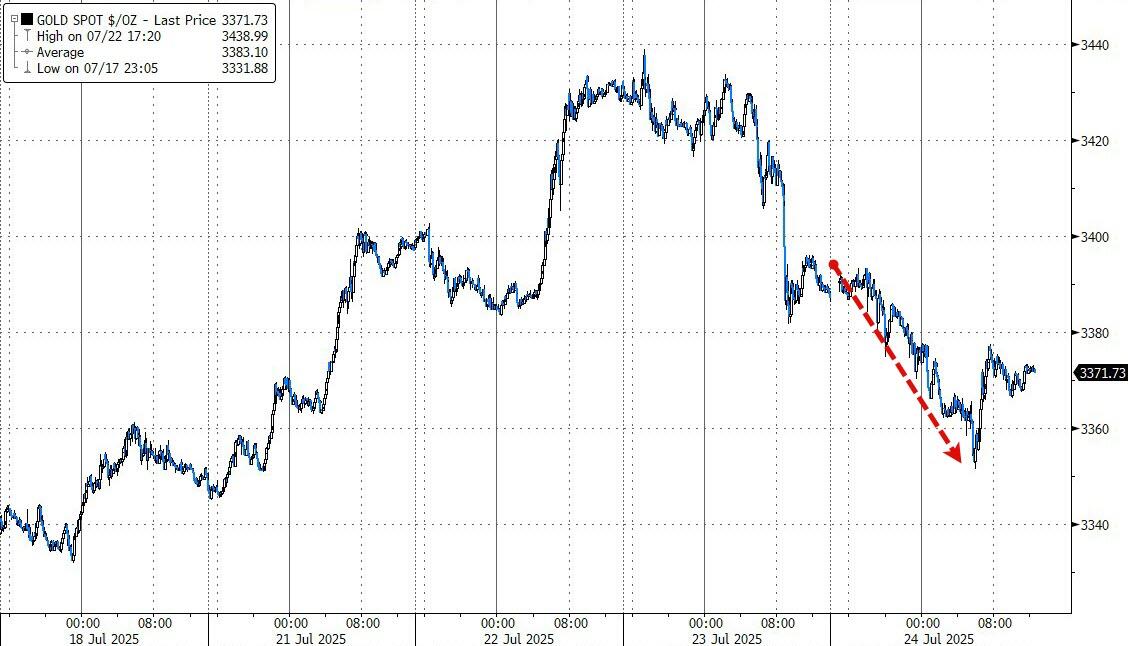
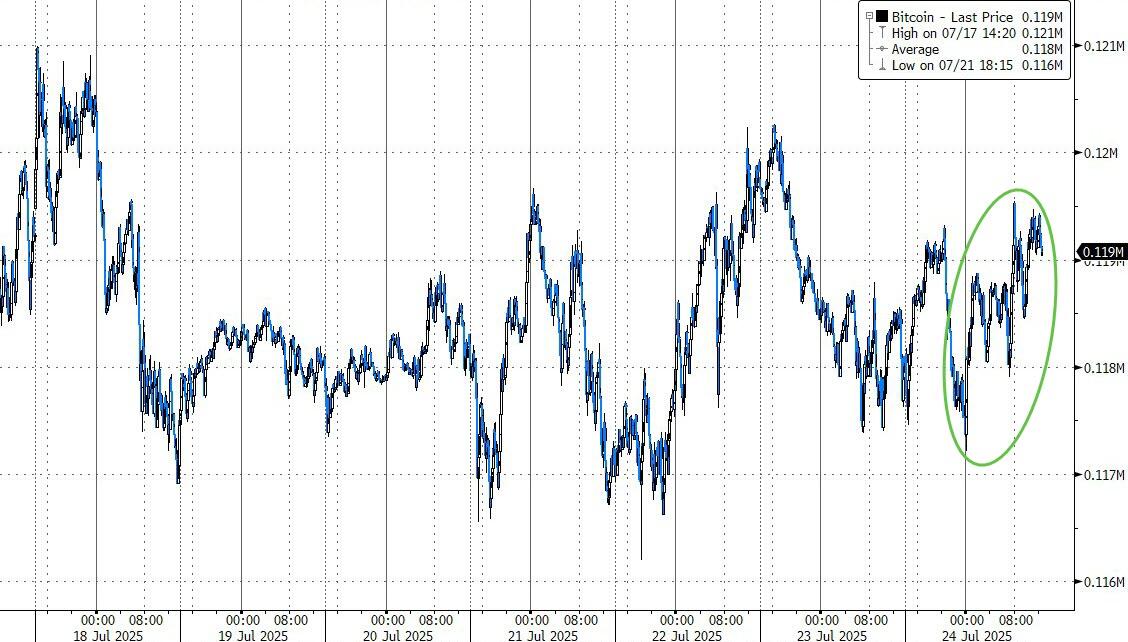
Small caps lagged, and bond yields rose—giving the dollar a modest bump but dragging gold prices lower. Meanwhile, Bitcoin bounced back after a rough overnight stretch.
All in all, it was a session stuck in uncertainty, with the market treading water once the closing bell rang.
With earnings season heating up, Fed drama brewing, and global trade talks hanging in the balance, will markets finally break out of this holding pattern—or are we in for more sideways churn?
2. Current domestic “Buy” Cycle (effective 5/20/2025); International “Buy” Cycle (effective 5/8/25)
Our domestic bullish cycle that began on November 21, 2023, concluded on April 3, 2025, following a market downturn triggered by President Trump’s tariff policy announcement.
This development caused significant declines across major indexes and broader market indices. However, markets subsequently rebounded, culminating in a new domestic “Buy” signal taking effect May 20, 2025.
Concurrently, our International Trend Tracking Index (TTI) experienced parallel volatility. On April 4, 2025, it breached critical thresholds, prompting a “Sell” recommendation. This position reversed as global markets recovered, with the International TTI regaining sufficient momentum to issue a new “Buy” signal effective May 8, 2025.
3. Trend Tracking Indexes (TTIs)
Today’s session felt like a whole lot of bobbing and weaving, with neither bulls nor bears really gaining the upper hand.
Gains and losses were pretty minimal, leaving the market mostly stuck in neutral.
Our TTIs stayed in the same groove but both pulled back just a little bit, reflecting that cautious mood.
This is how we closed 07/24/2025:
Domestic TTI: +6.12% above its M/A (prior close +6.46%)—Buy signal effective 5/20/25.
International TTI: +10.39% above its M/A (prior close +10.44%)—Buy signal effective 5/8/25.
All linked charts above are courtesy of Bloomberg via ZeroHedge.
———————————————————-
WOULD YOU LIKE TO HAVE YOUR INVESTMENTS PROFESSIONALLY MANAGED?
Do you have the time to follow our investment plans yourself? If you are a busy professional who would like to have his portfolio managed using our methodology, please contact me directly to get more details.
Contact Ulli