
- Moving the market
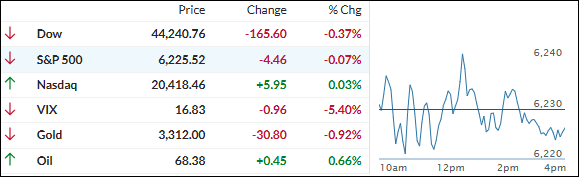
Yesterday’s tariff drama spilled into today’s session, leaving the markets wobbling as they tried to find their footing.
The major indexes mostly drifted sideways, with little conviction either way. President Trump once again pushed back the tariff deadline and hinted at some wiggle room for countries open to negotiating, which added to the uncertainty.
Some traders are starting to think the worst of the tariff battle might be behind us, and that the new measures may not be as harsh as originally feared. Still, doubt continues to hang over the market, keeping things sluggish.
Early gains from heavyweights like Nvidia and Tesla gave some hope, but Tesla later reversed course. Big banks like JPMorgan, Bank of America, and Goldman Sachs also took a hit after a downgrade from HSBC, making them the day’s worst performers.
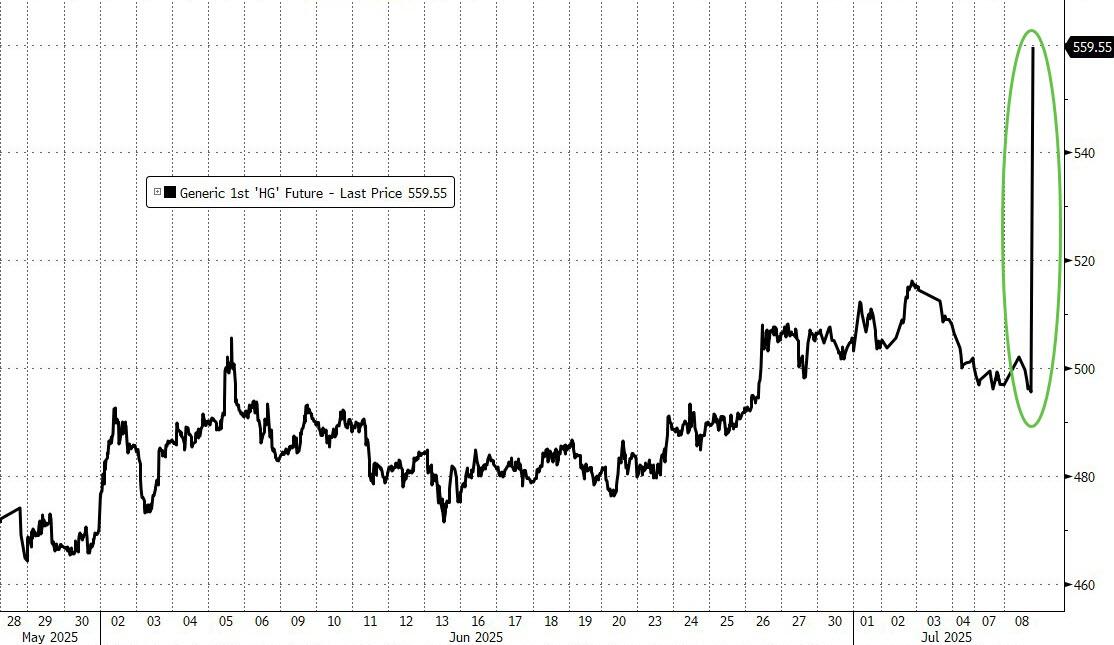
On the flip side, copper had a standout day. Thanks to Trump’s plan to slap a 50% tariff on copper imports, the metal surged over 10% before pulling back slightly. Our copper ETF still locked in a solid +8.2% gain for the day.
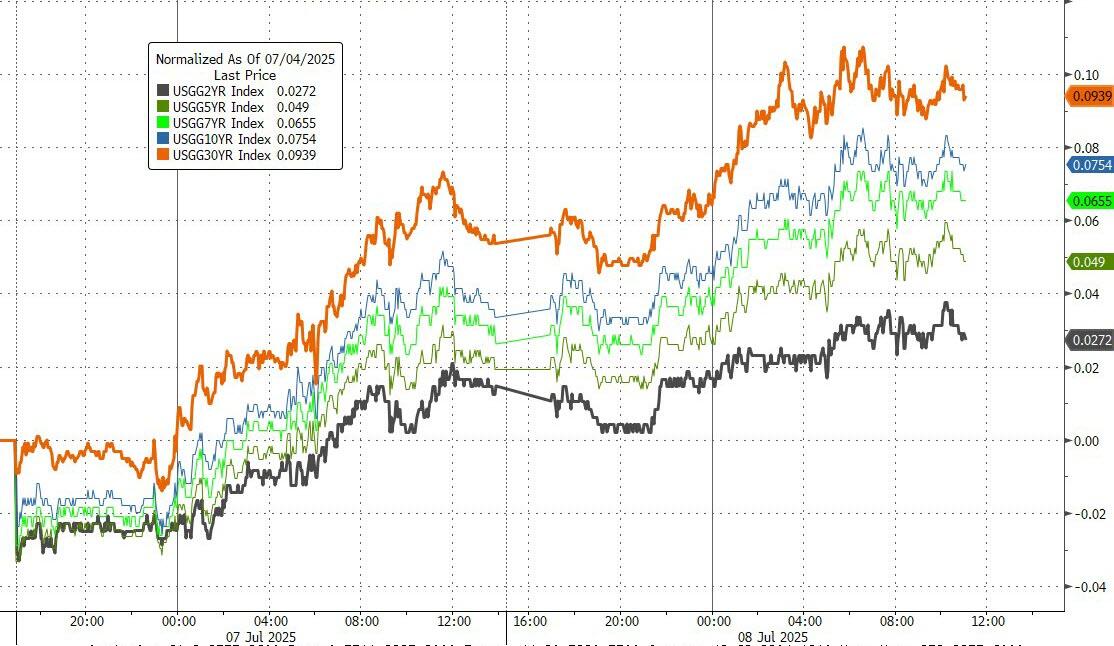
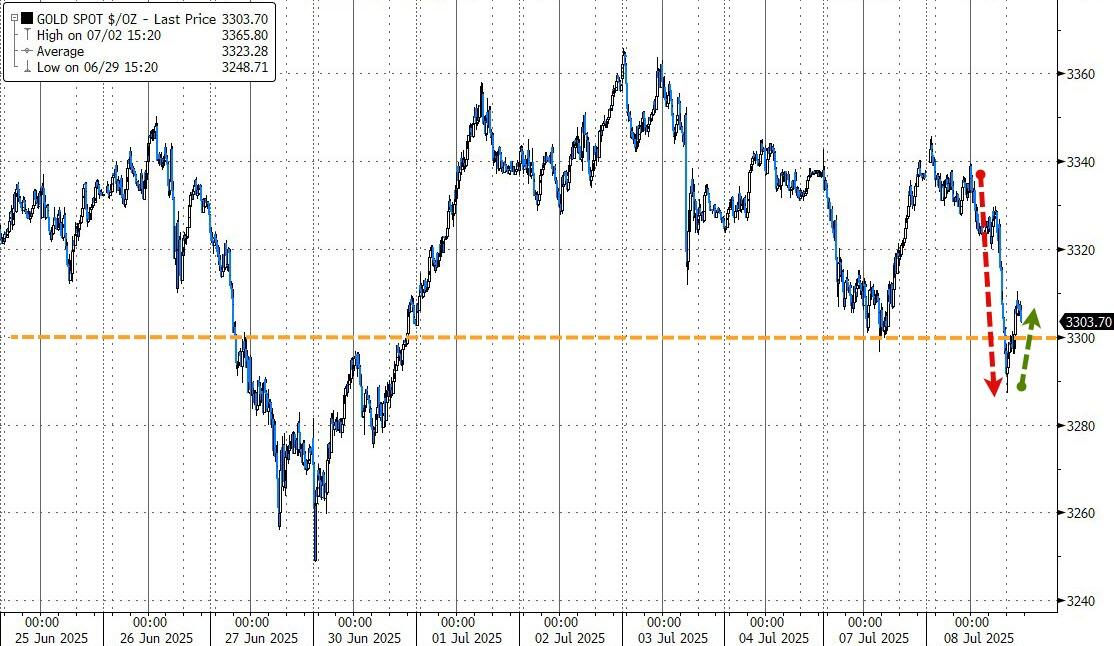
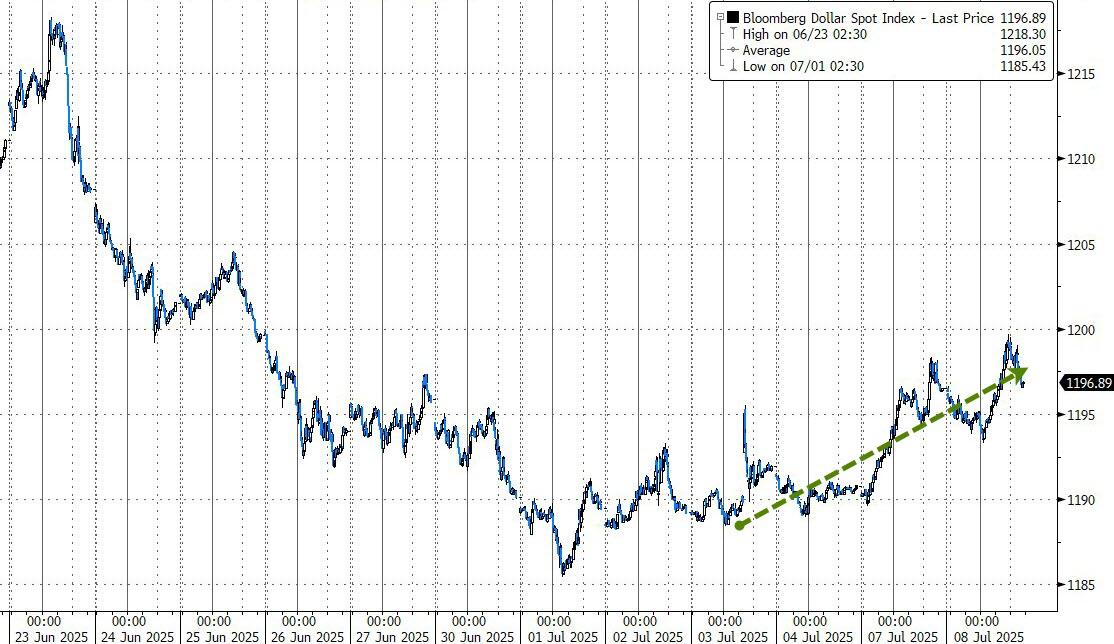
Elsewhere, bond yields kept climbing, gold dipped but found support around $3,300, and the dollar got a boost from those rising yields. Bitcoin bounced around but managed to close in the green.
So, here we are—stuck in a sideways market, even though we’re in what’s usually the strongest part of the year.
Will a softening in trade tensions be enough to spark a rally, or will it take some Fed magic and falling yields to get things moving again?
2. Current domestic “Buy” Cycle (effective 5/20/2025); International “Buy” Cycle (effective 5/8/25)
Our domestic bullish cycle that began on November 21, 2023, concluded on April 3, 2025, following a market downturn triggered by President Trump’s tariff policy announcement.
This development caused significant declines across major indexes and broader market indices. However, markets subsequently rebounded, culminating in a new domestic “Buy” signal taking effect May 20, 2025.
Concurrently, our International Trend Tracking Index (TTI) experienced parallel volatility. On April 4, 2025, it breached critical thresholds, prompting a “Sell” recommendation. This position reversed as global markets recovered, with the International TTI regaining sufficient momentum to issue a new “Buy” signal effective May 8, 2025.
3. Trend Tracking Indexes (TTIs)
Today’s market felt like it was just wandering around without a purpose. The major indexes didn’t really go anywhere, and whatever bullish energy traders had seemed to have fizzled out.
In the end, it was a pretty uneventful day—no big gains, no major losses.
On the bright side, both of our TTIs made some progress, with the domestic one showing a bit more momentum than the international one.
This is how we closed 07/08/2025:
Domestic TTI: +4.91% above its M/A (prior close +4.63%)—Buy signal effective 5/20/25.
International TTI: +8.96% above its M/A (prior close +8.76%)—Buy signal effective 5/8/25.
All linked charts above are courtesy of Bloomberg via ZeroHedge.
———————————————————-
WOULD YOU LIKE TO HAVE YOUR INVESTMENTS PROFESSIONALLY MANAGED?
Do you have the time to follow our investment plans yourself? If you are a busy professional who would like to have his portfolio managed using our methodology, please contact me directly to get more details.
Contact Ulli