

- Moving the market
Tech stocks took the lead today, helping the market bounce back after the Dow’s two-day slide.
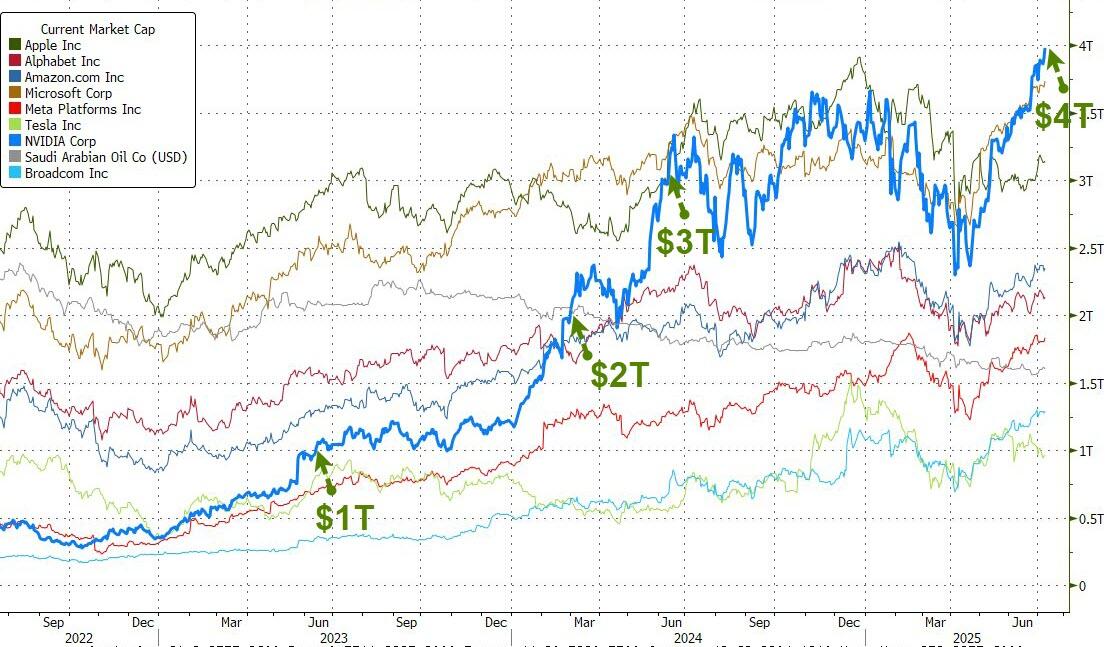
Nvidia stole the spotlight—not just for its 2% gain, but for becoming the first company ever to hit a $4 trillion market cap. That’s a milestone worth pausing for.
Other big tech names like Meta, Microsoft, and Alphabet joined the rally, riding the renewed wave of excitement around AI. Meanwhile, traders mostly shrugged off the latest tariff chatter.
The Fed minutes were the day’s main event, but they didn’t offer much clarity—just more of the same uncertainty.
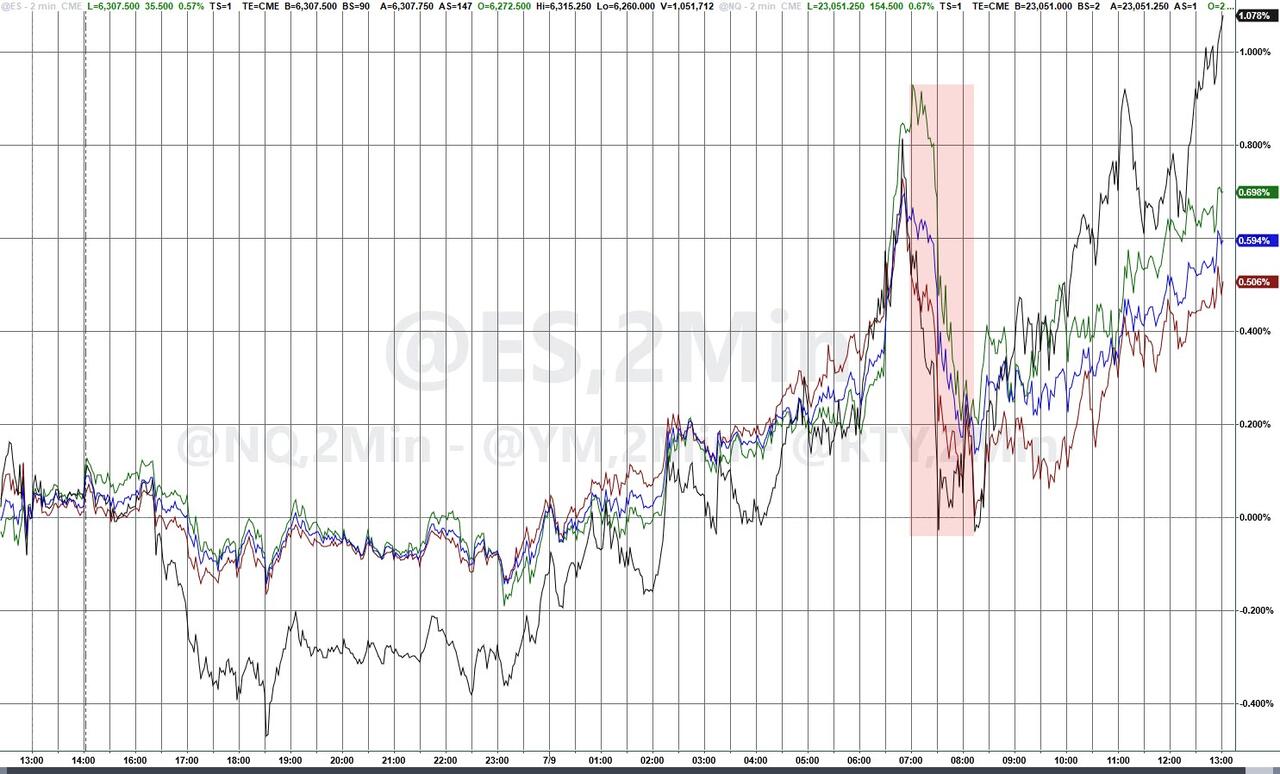
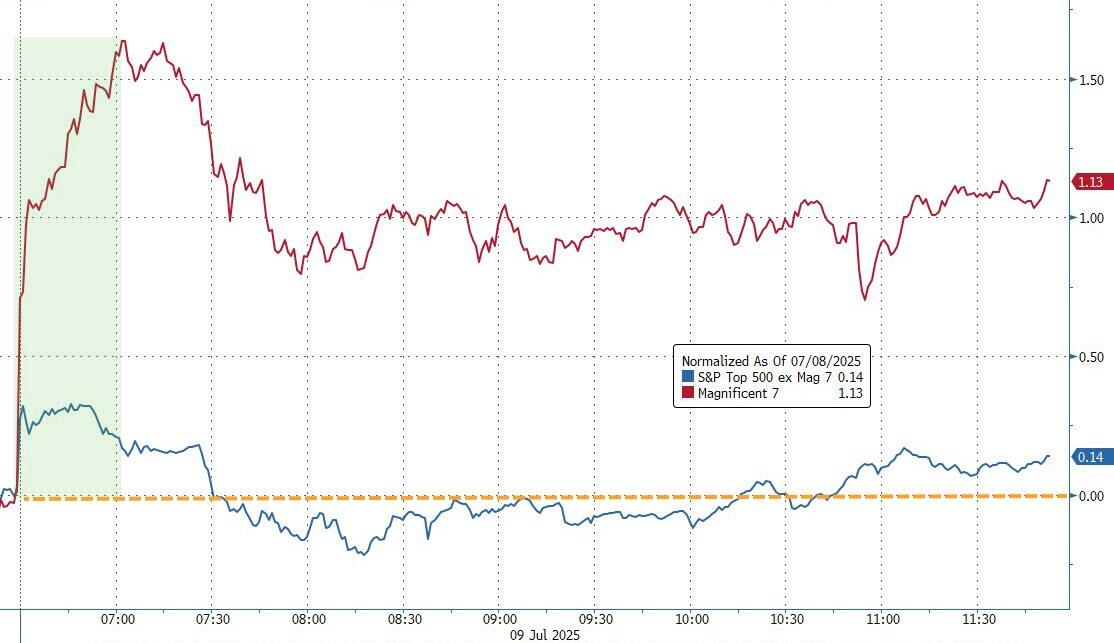
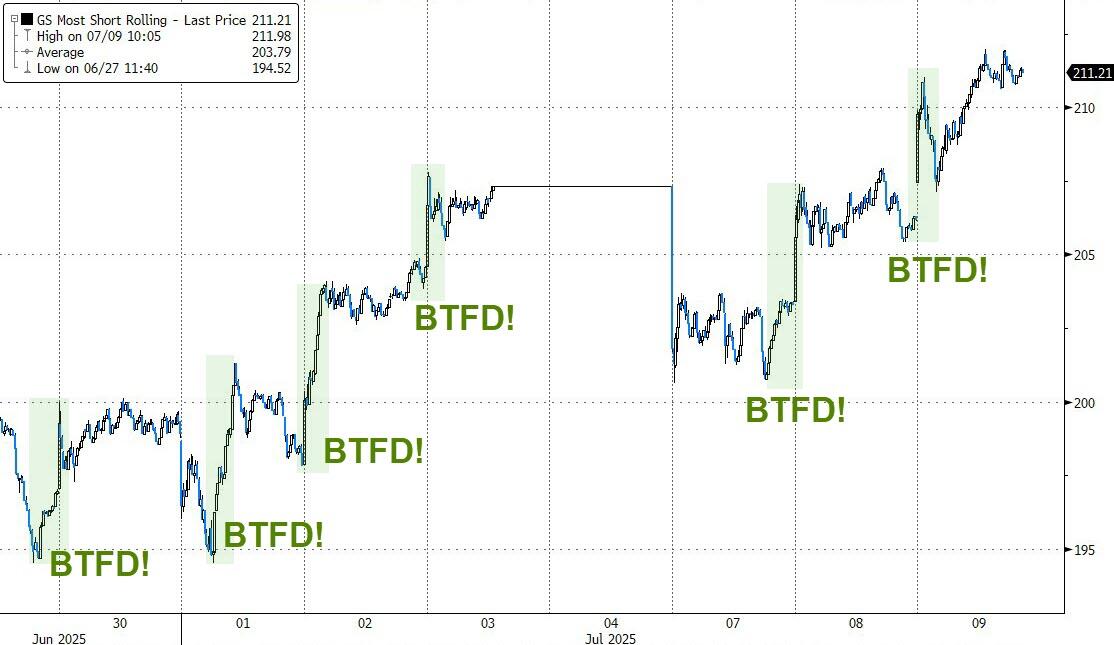
Still, the market found its footing after a midday dip sparked by Trump’s new round of tariff letters. Dip buyers jumped in quickly, especially in the Mag7 names, where a short squeeze added some extra fuel.
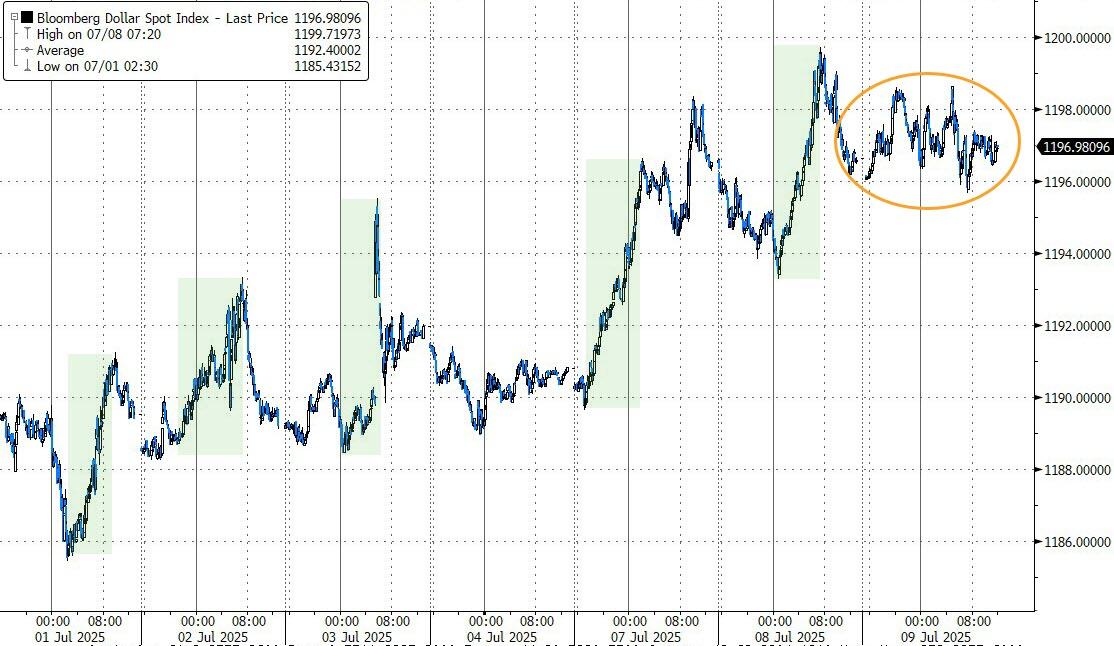
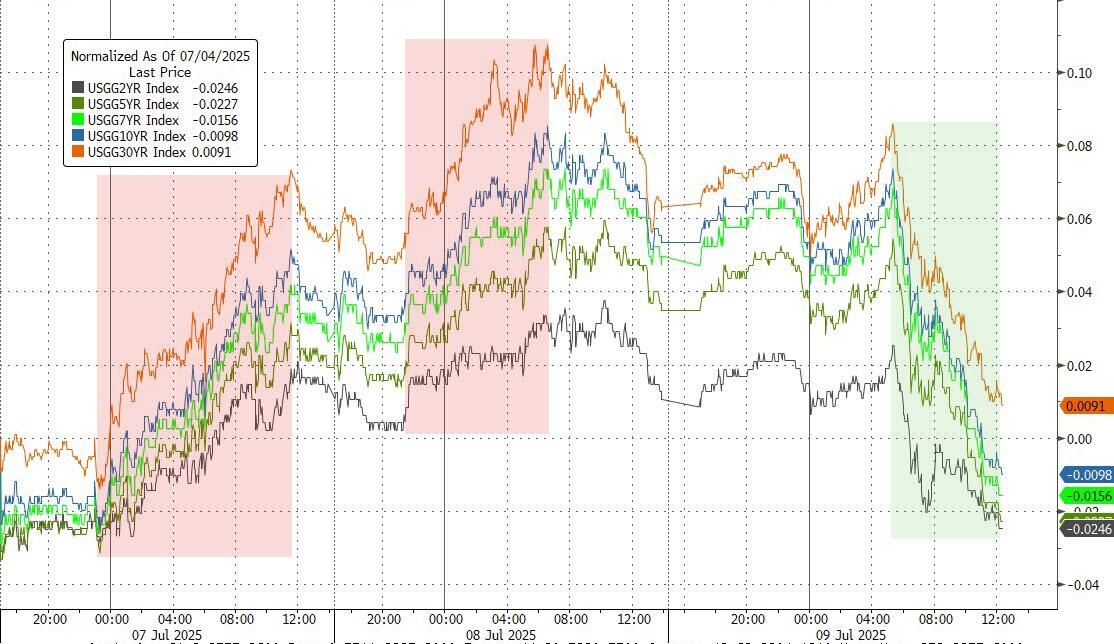
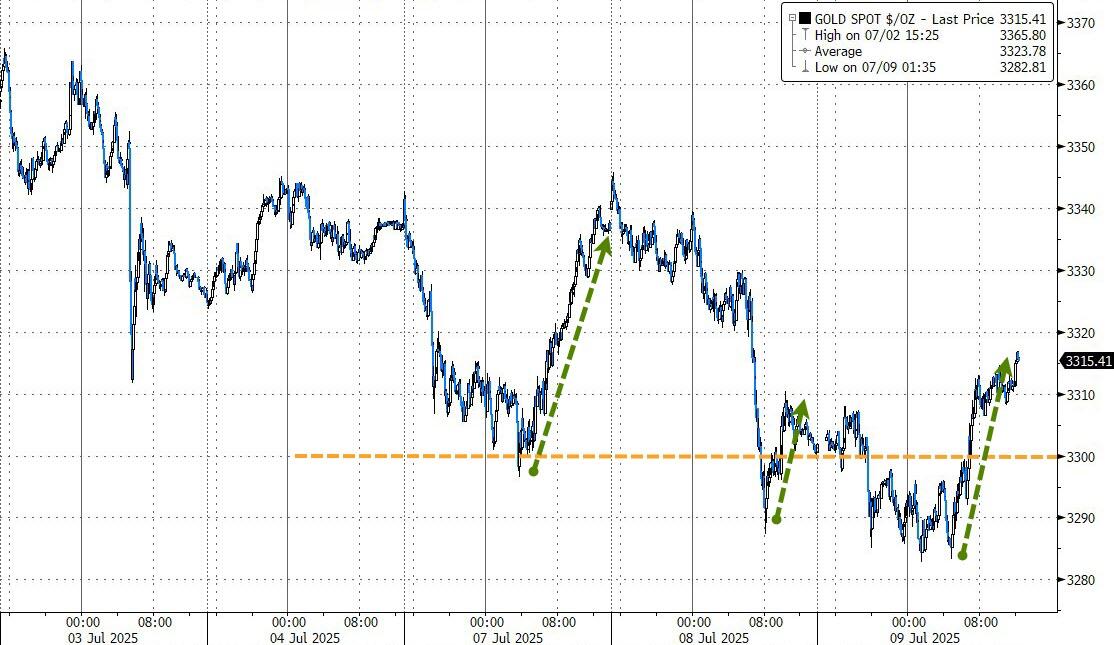
Elsewhere, the dollar stayed flat while bond yields slipped. Gold clawed its way back above $3,300 after briefly dipping below that level earlier.
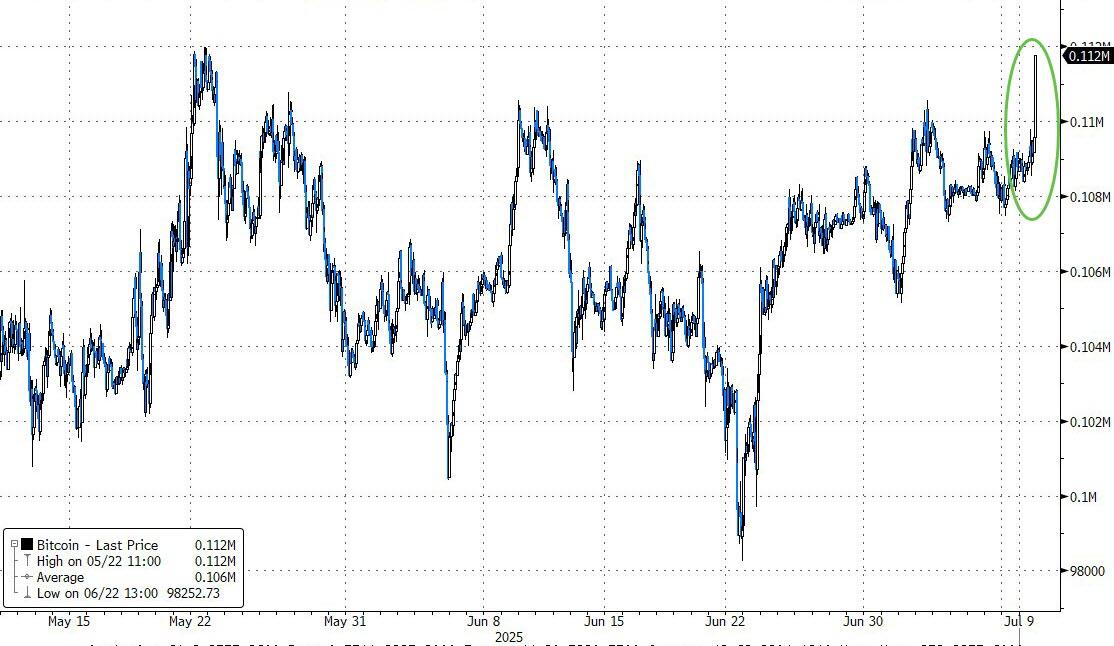
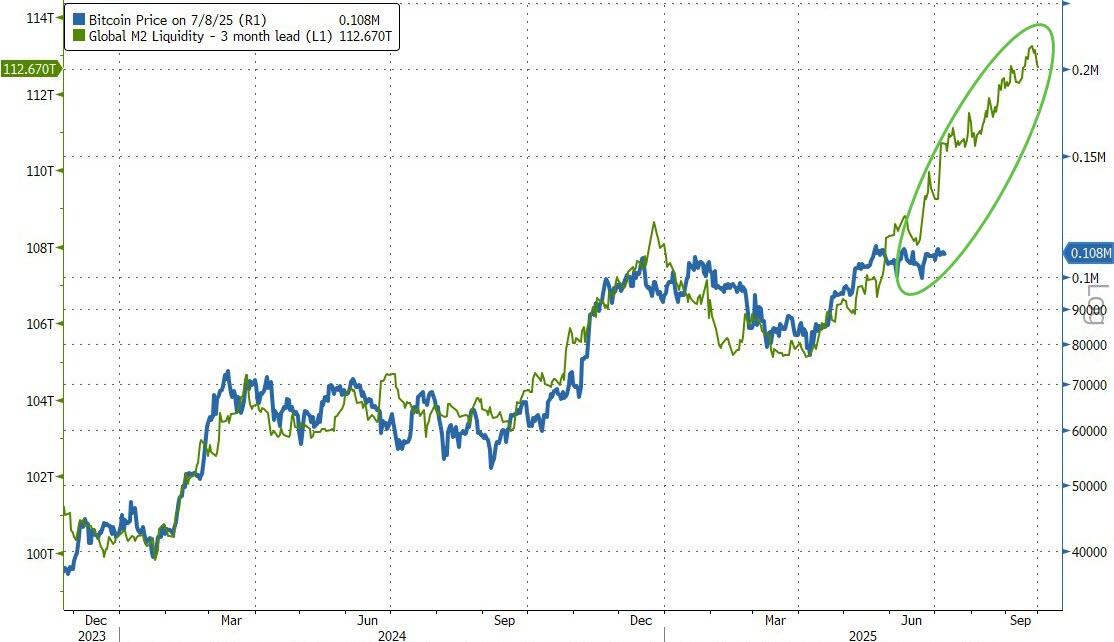
Copper had another solid session, up 1.6%, but Bitcoin stole the show—surging toward its all-time high of $112K and closing at its highest level ever at the end of U.S. market hours. (Of course, Bitcoin never really “closes.”)
As I’ve said before, Bitcoin seems to be moving in lockstep with global liquidity trends—and this chart backs that up.
2. Current domestic “Buy” Cycle (effective 5/20/2025); International “Buy” Cycle (effective 5/8/25)
Our domestic bullish cycle that began on November 21, 2023, concluded on April 3, 2025, following a market downturn triggered by President Trump’s tariff policy announcement.
This development caused significant declines across major indexes and broader market indices. However, markets subsequently rebounded, culminating in a new domestic “Buy” signal taking effect May 20, 2025.
Concurrently, our International Trend Tracking Index (TTI) experienced parallel volatility. On April 4, 2025, it breached critical thresholds, prompting a “Sell” recommendation. This position reversed as global markets recovered, with the International TTI regaining sufficient momentum to issue a new “Buy” signal effective May 8, 2025.
3. Trend Tracking Indexes (TTIs)
The day started off on a strong note, but momentum faded around midday as the markets pulled back.
Still, they managed to bounce back nicely in the afternoon—though not quite enough to retest the morning highs.
On the bright side, our TTIs moved in step with the major indexes and ended the day in positive territory.
This is how we closed 07/09/2025:
Domestic TTI: +5.22% above its M/A (prior close +4.91%)—Buy signal effective 5/20/25.
International TTI: +9.42% above its M/A (prior close +8.96%)—Buy signal effective 5/8/25.
All linked charts above are courtesy of Bloomberg via ZeroHedge.
———————————————————-
WOULD YOU LIKE TO HAVE YOUR INVESTMENTS PROFESSIONALLY MANAGED?
Do you have the time to follow our investment plans yourself? If you are a busy professional who would like to have his portfolio managed using our methodology, please contact me directly to get more details.
Contact Ulli