
ETF Tracker StatSheet
You can view the latest version here.
STOCKS REBOUND IN MAY, BUT TRADE TENSIONS AND FISCAL FEARS LINGER
- Moving the market
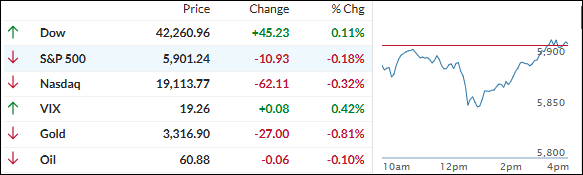
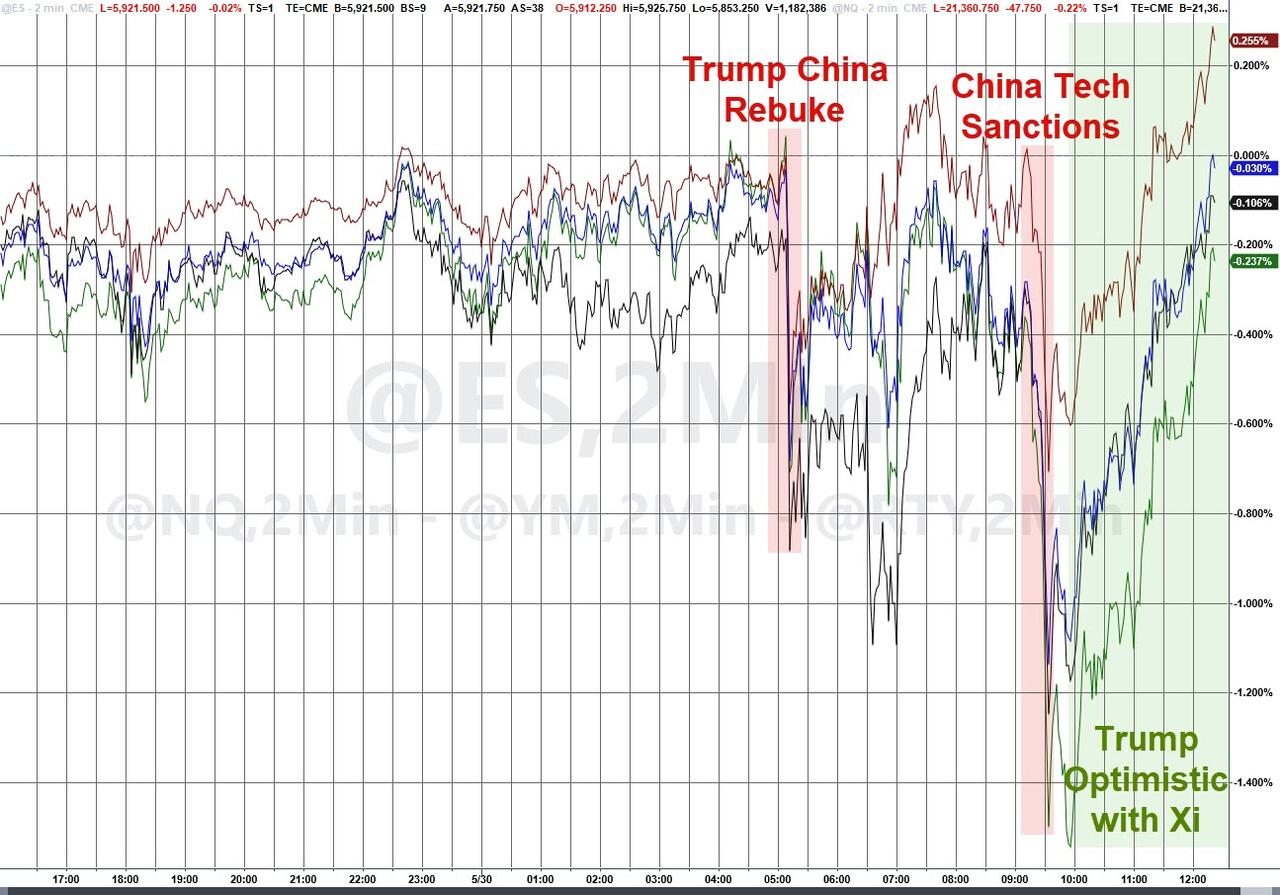
Stocks stumbled out of the gate today after President Trump accused China of breaking its initial trade deal—rekindling fears of a renewed trade war. That headline alone was enough to rattle traders early on.
Adding fuel to the fire was the legal uncertainty surrounding the administration’s aggressive tariff plans.
A court ruling on Wednesday night temporarily blocked most of the tariffs, only for an appeals court to step in Thursday afternoon and keep them alive—at least for now. The back-and-forth has made it tough to see how or when a lasting U.S.-China trade agreement might happen.
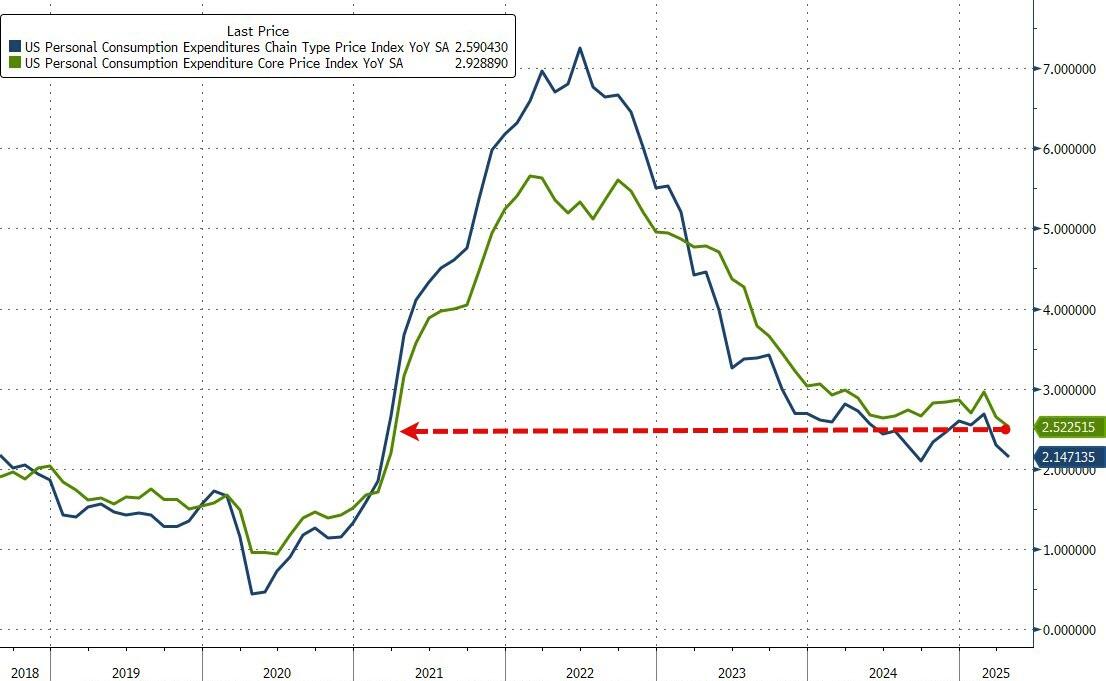
On the bright side, the Fed’s go-to inflation gauge—the PCE—dropped to a four-year low. That could make it harder for Fed Chair Powell to justify holding off on more rate cuts.
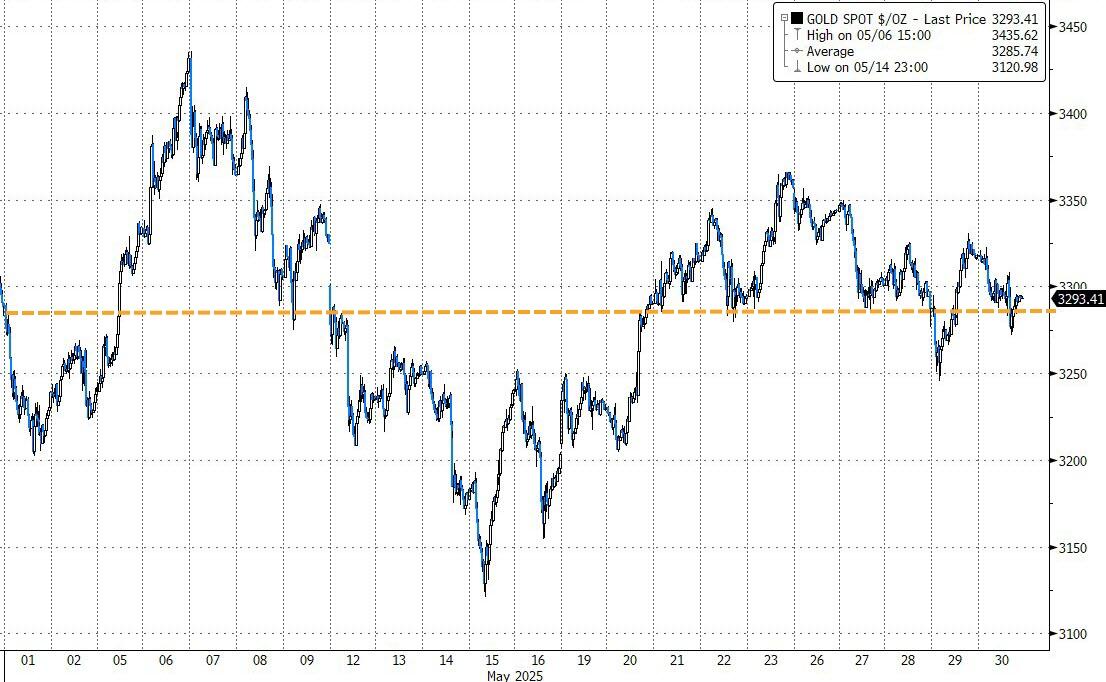
Despite today’s turbulence, May turned out to be a strong month for equities. The S&P 500 bounced back with a +6.2% gain, clawing its way into positive territory for the year—barely—at +0.80%. Still, that’s a far cry from gold’s impressive +25% YTD surge.
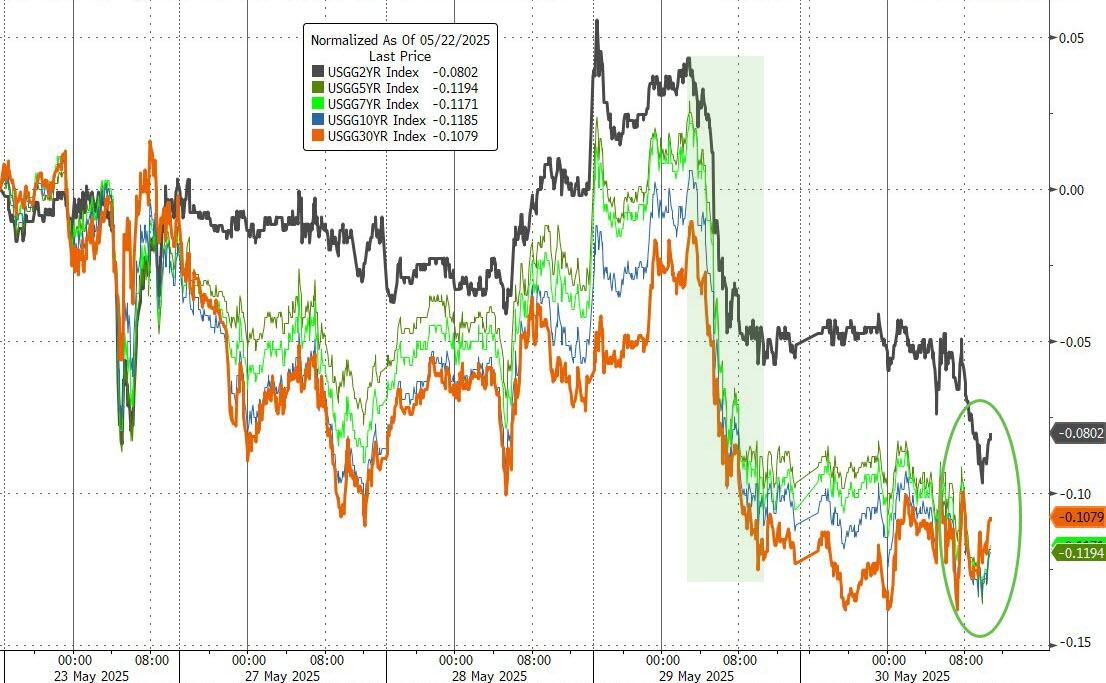
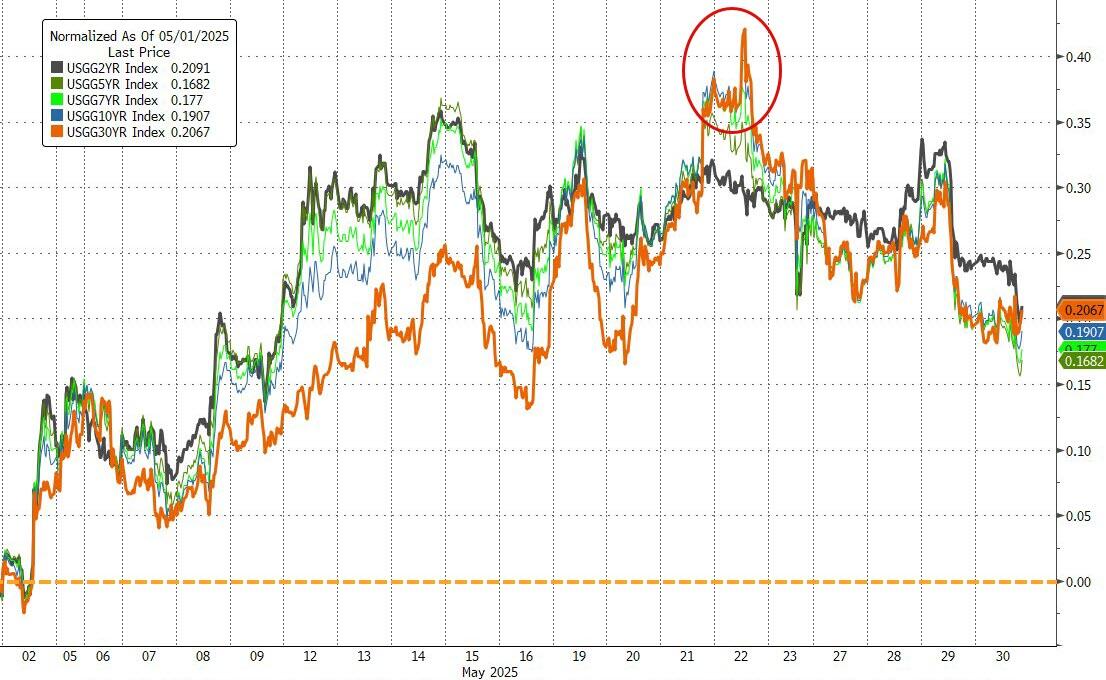
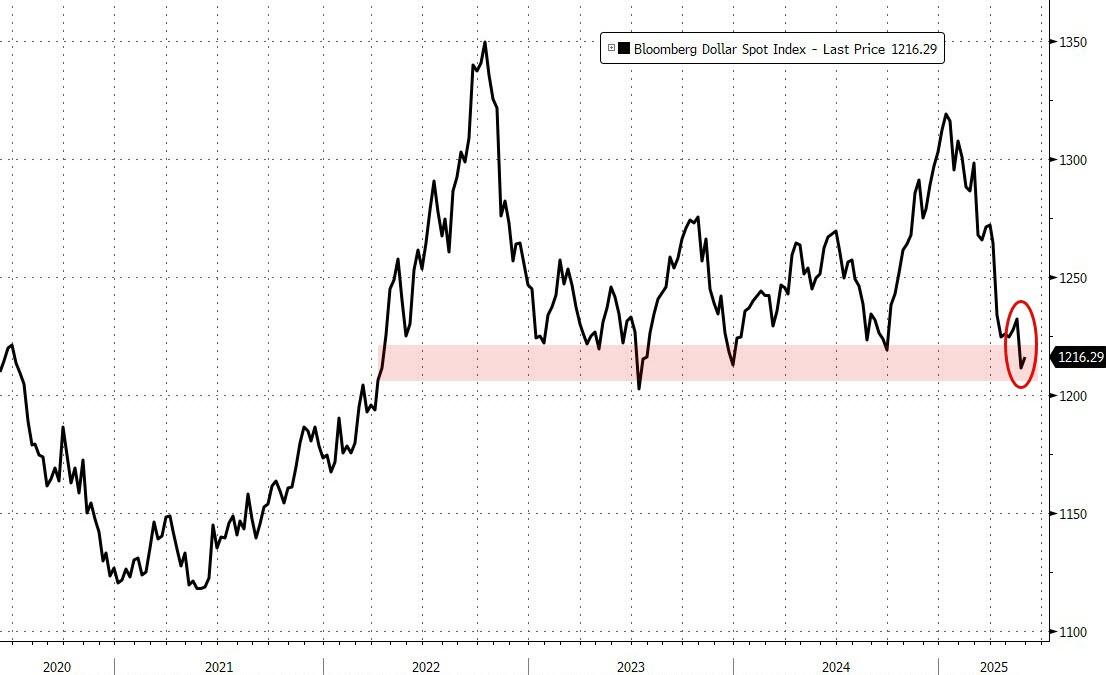
Elsewhere, bond yields dipped for the week but rose for the month. The dollar slid for the fifth month in a row, while gold notched a modest fourth straight monthly gain.
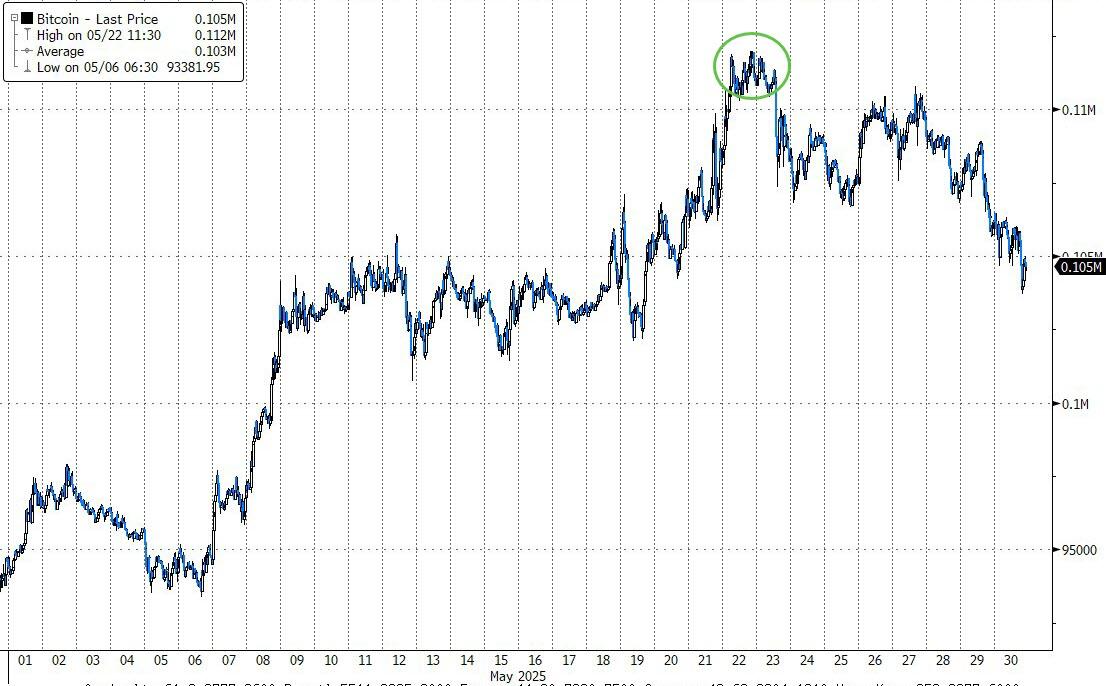
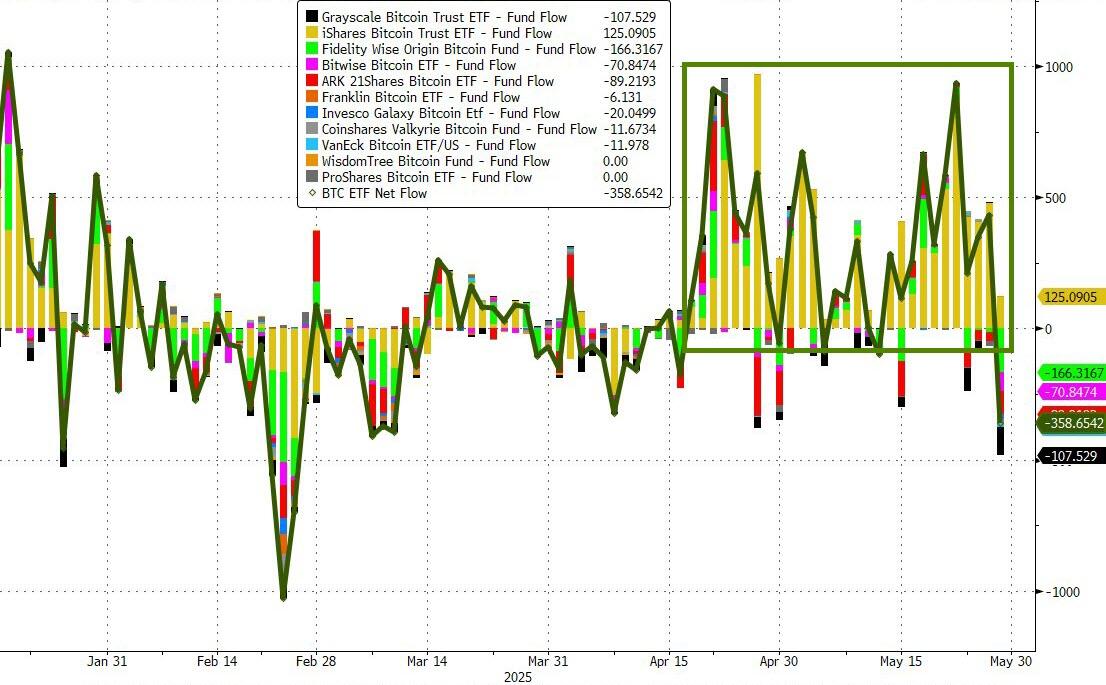
Bitcoin stole the spotlight again, jumping 11% in May and hitting a new all-time high, thanks in part to strong inflows into BTC ETFs.
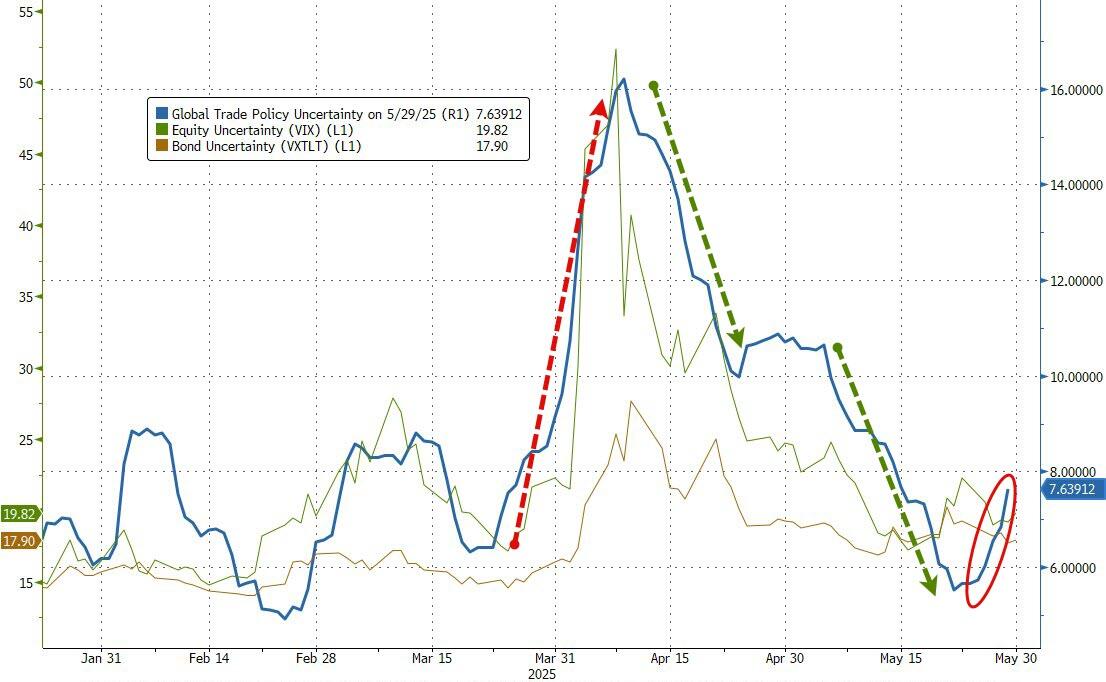
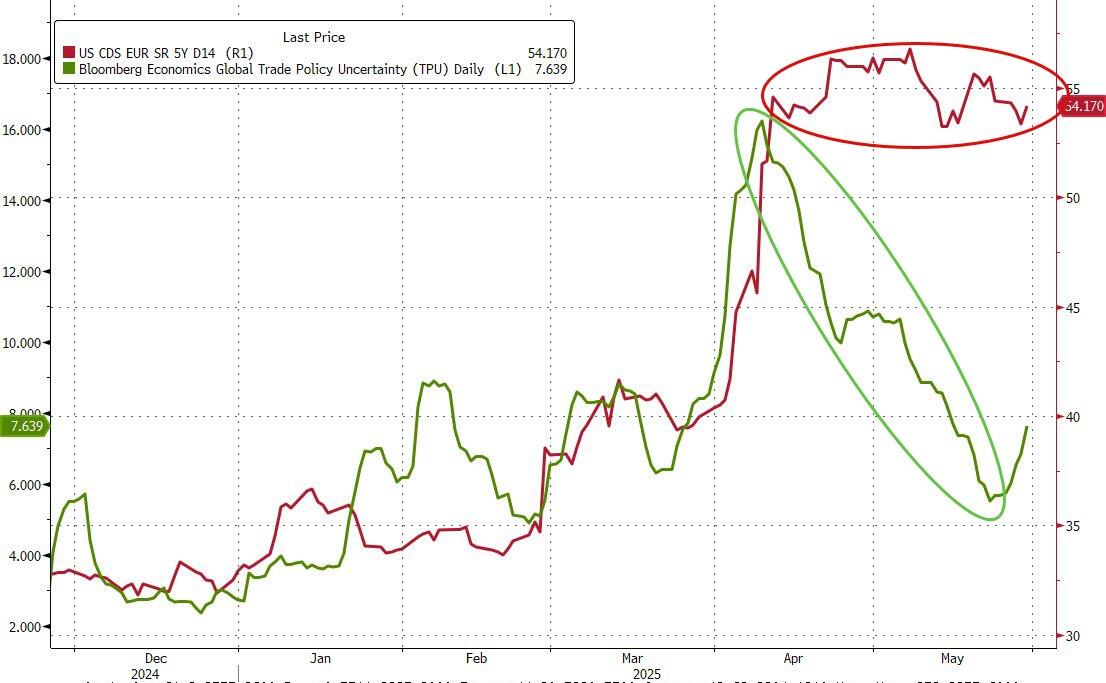
As ZeroHedge noted, even though trade policy uncertainty has eased a bit, concerns about U.S. fiscal stability and default risk are still hanging over the market.
2. Current domestic “Buy” Cycle (effective 5/20/2025); International “Buy” Cycle (effective 5/8/25)
Our domestic bullish cycle that began on November 21, 2023, concluded on April 3, 2025, following a market downturn triggered by President Trump’s tariff policy announcement.
This development caused significant declines across major indexes and broader market indices. However, markets subsequently rebounded, culminating in a new domestic “Buy” signal taking effect May 20, 2025.
Concurrently, our International Trend Tracking Index (TTI) experienced parallel volatility. On April 4, 2025, it breached critical thresholds, prompting a “Sell” recommendation. This position reversed as global markets recovered, with the International TTI regaining sufficient momentum to issue a new “Buy” signal effective May 8, 2025.
3. Trend Tracking Indexes (TTIs)
The markets pretty much stayed on cruise control today, hovering near the flatline for most of the session.
There was a brief dip around midday, but it bounced back just as quickly—ultimately, not much changed by the closing bell.
Our TTIs followed a similar path, slipping slightly from their previous levels. But the move wasn’t significant enough to shake our current positive outlook.
This is how we closed 05/30/2025:
Domestic TTI: +0.41% above its M/A (prior close +0.49%)—Buy signal effective 5/20/25.
International TTI: +5.88% above its M/A (prior close +6.20%)—Buy signal effective 5/8/25.
All linked charts above are courtesy of Bloomberg via ZeroHedge.
———————————————————-
WOULD YOU LIKE TO HAVE YOUR INVESTMENTS PROFESSIONALLY MANAGED?
Do you have the time to follow our investment plans yourself? If you are a busy professional who would like to have his portfolio managed using our methodology, please contact me directly to get more details.
Contact Ulli