
- Moving the market
Hopes that tariff deals with many countries could be negotiated for mutual benefit provided a brief reprieve from recent market turmoil, bringing some calm even as tensions remained. The broad market bounced back sharply as news spread that around 70 countries had contacted the U.S. to discuss alternative proposals.
After three days of steep losses and violent volatility, including the highest trading volume in 18 years and a brief dip into bear market territory (-20%), any easing of trade tensions was bound to create a relief rally. This is what we witnessed this morning, but it remains to be seen if this marks the end of the sell-off or just a temporary respite.
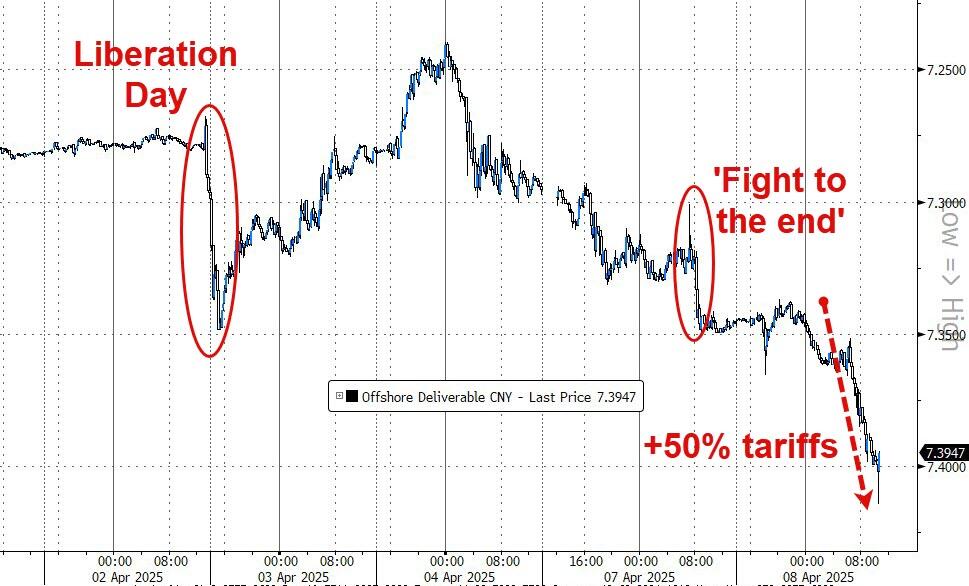
Unfortunately, U.S. stocks suffered a major reversal as tariff rhetoric between Trump and China intensified, pulling the indexes not only off their lofty levels but deep into the red, confirming that we indeed saw a dead cat bounce. Trump confirmed an additional 104% of tariffs on China, set to take effect at midnight, which crashed the offshore Yuan to a record low against the dollar.
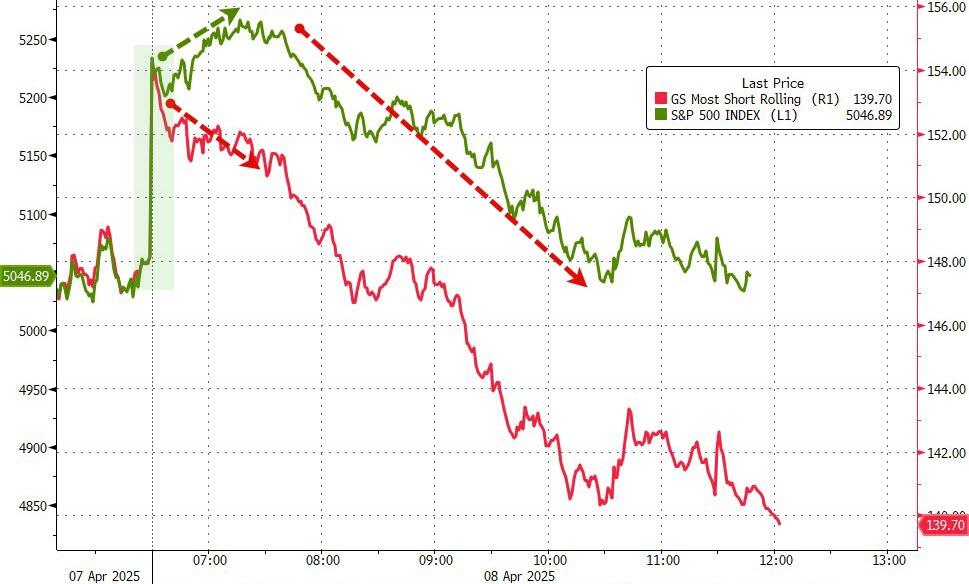
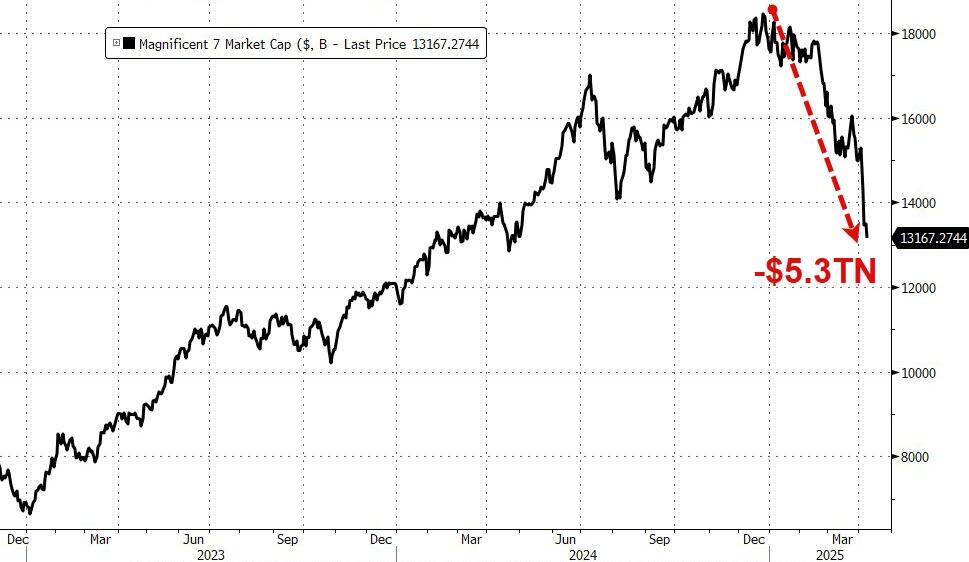
The massive short squeeze, which had propelled the S&P 500 to rally 4% intraday, ended abruptly with the index closing down over 1.5% and losing its $5,000 level. Meanwhile, the Mag7 basket also suffered, having lost $5.3 trillion in market cap since its peak.
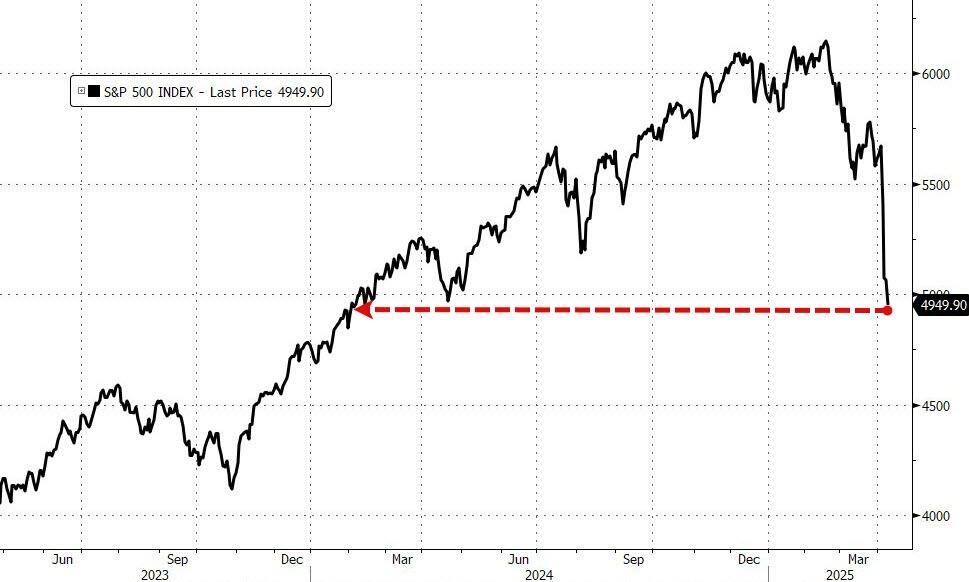
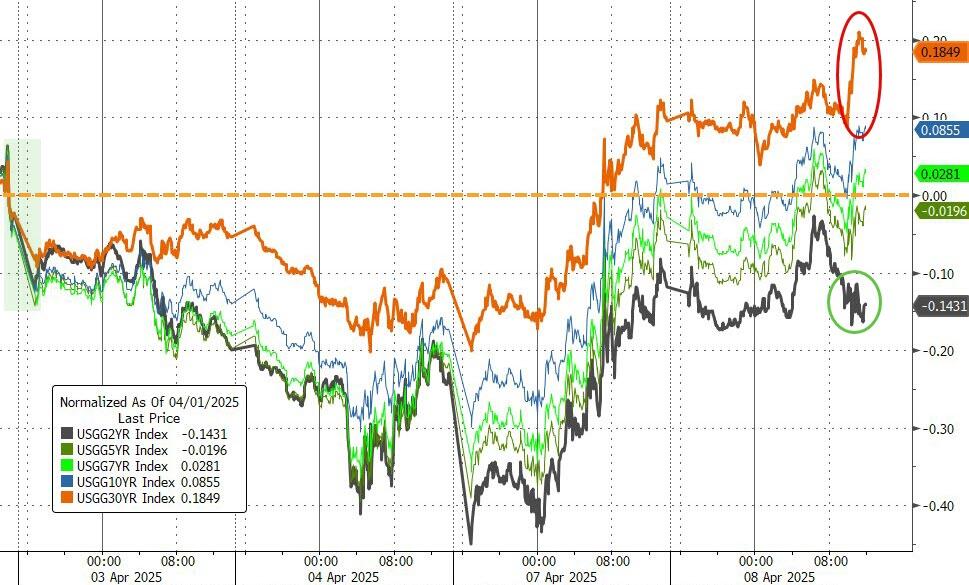
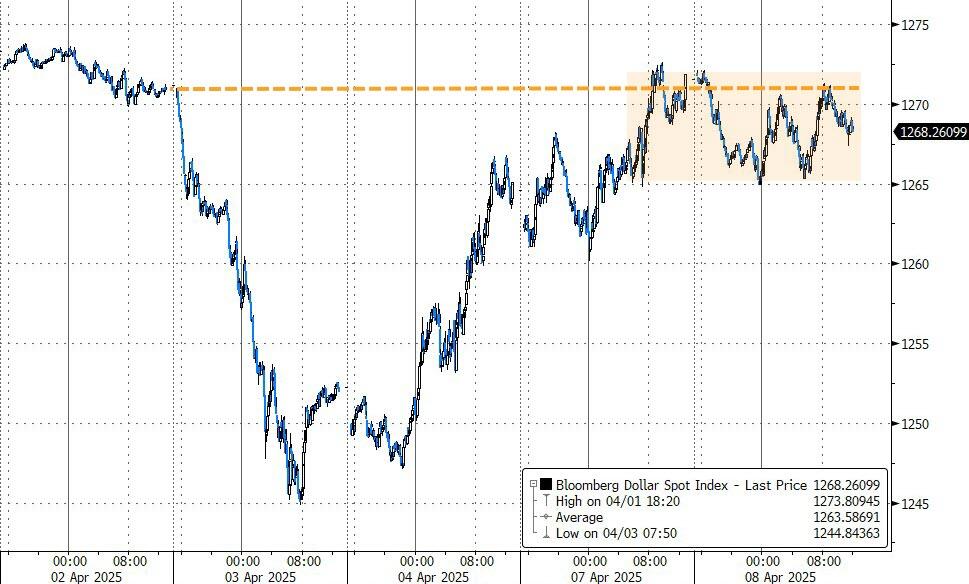
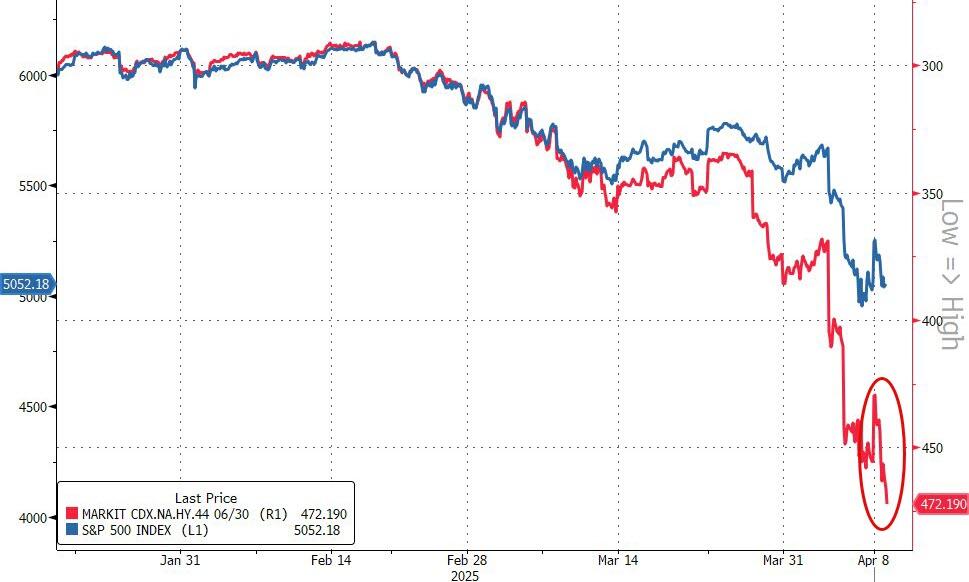
Bond yields rose, the dollar remained steady, but credit markets are starting to crack and are at their widest since November 23, as noted by ZH. If the S&P 500 continues this path, we may have a long way to go before finding a bottom.
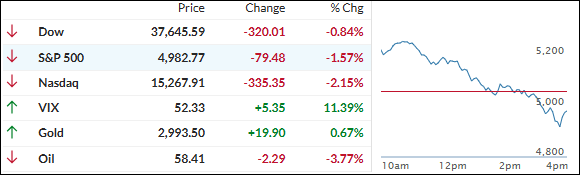
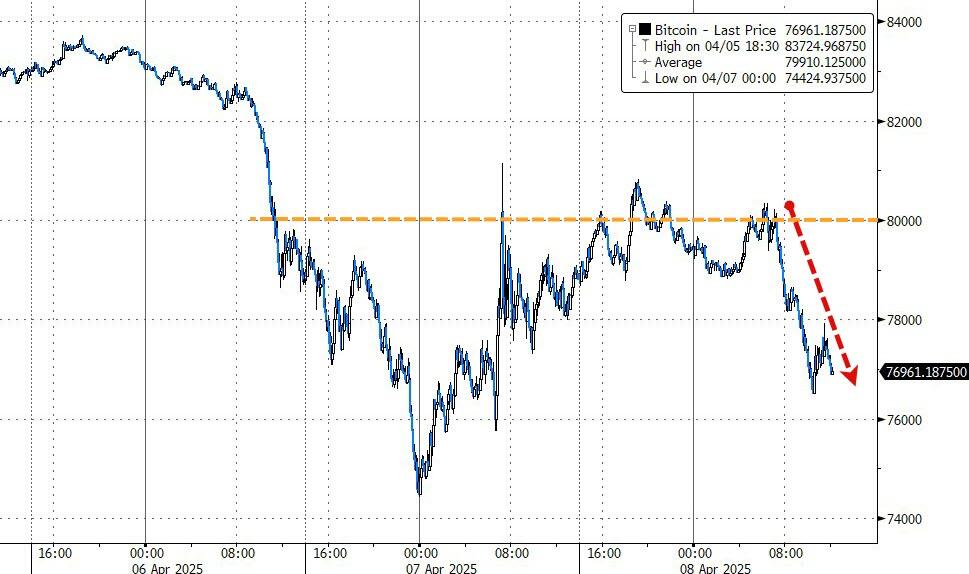
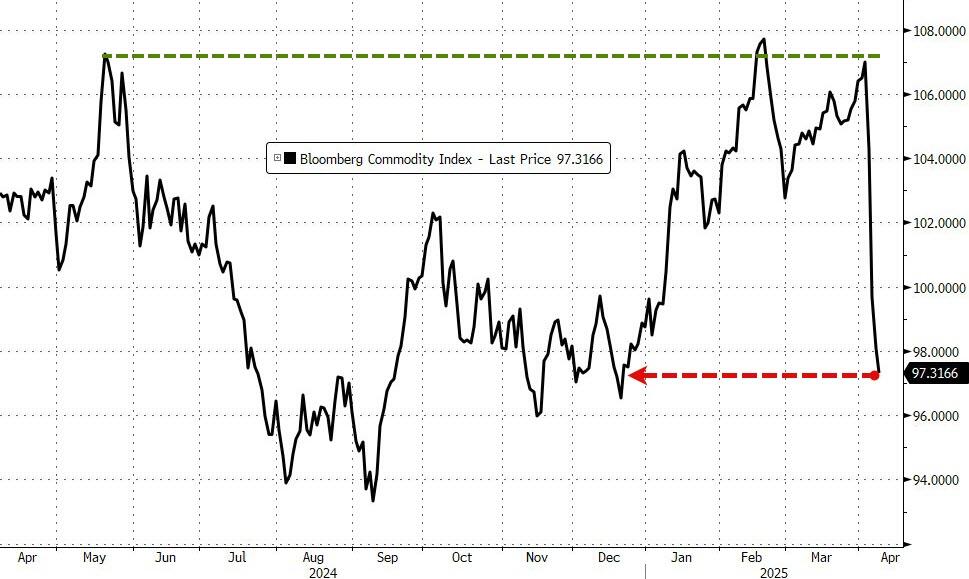
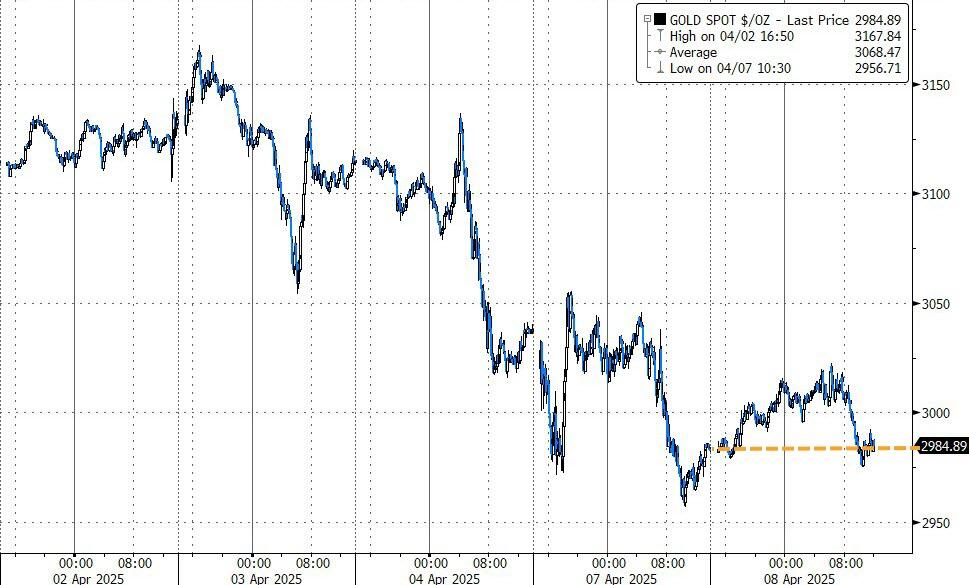
Bitcoin lost its $80k level again, commodities were crushed, and only gold managed to hold onto any gains by the close.
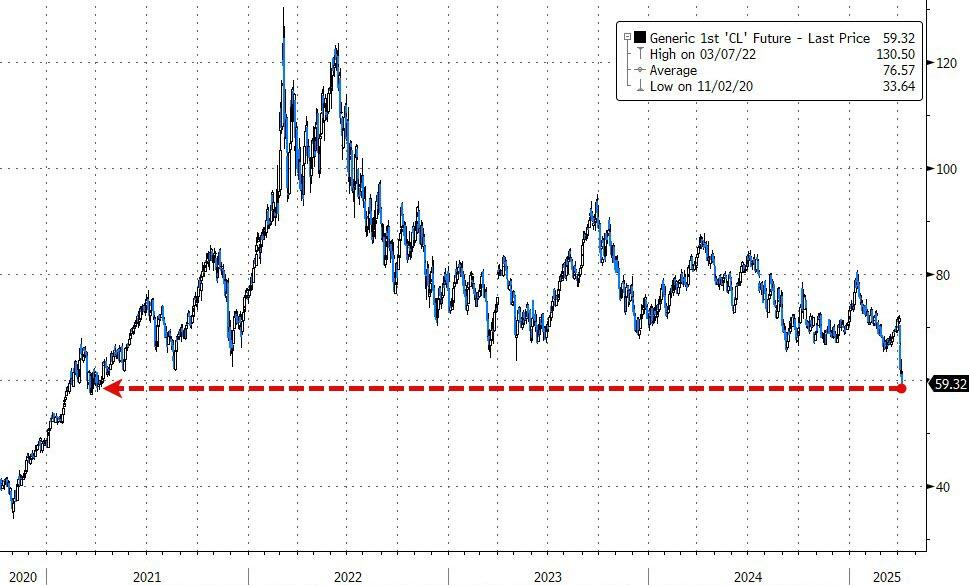
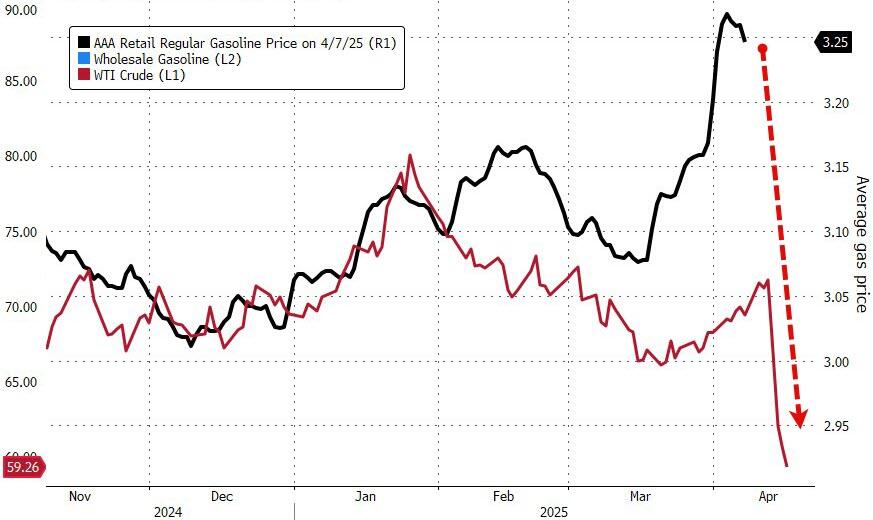
Crude oil fell below $60 to a new 4-year low, suggesting that prices at the pump could drop significantly.
2. Current “Sell” Cycle (effective 4/4/25)
Our domestic Buy cycle, which began on November 21, 2023, ended on April 3, 2025. The market reacted negatively to Trump’s tariff policy, causing major indexes and the broader market to drop sharply.
This confirmed the bearish trend that had been pushing our domestic TTI (Trend Tracking Index) below its trend line since March 10, 2025, but it wasn’t enough to end the Buy cycle until now. Consequently, we have exited the domestic market.
Meanwhile, our International TTI dropped sharply on April 4, 2025, generating a “Sell” signal. Since we did not have any exposure in international markets, we were not affected.
3. Trend Tracking Indexes (TTIs)
The session began on a euphoric note but quickly reversed course when news of additional tariffs on China dampened bullish sentiment, leading to a sharp decline.
The major indexes not only lost all their gains but closed in the red.
Our TTIs showed mixed results: the domestic TTI dropped, while the international TTI edged higher.
This is how we closed 04/08/2025:
Domestic TTI: -12.67% below its M/A (prior close -10.99%)—Sell signal effective 4/4/25.
International TTI: -8.08% below its M/A (prior close -8.60%)—Sell signal effective 4/7/25.
All linked charts above are courtesy of Bloomberg via ZeroHedge.
———————————————————-
WOULD YOU LIKE TO HAVE YOUR INVESTMENTS PROFESSIONALLY MANAGED?
Do you have the time to follow our investment plans yourself? If you are a busy professional who would like to have his portfolio managed using our methodology, please contact me directly to get more details.
Contact Ulli