
- Moving the market
An early stumble interrupted April’s comeback rally as bad news about the U.S. economy pulled the markets down.
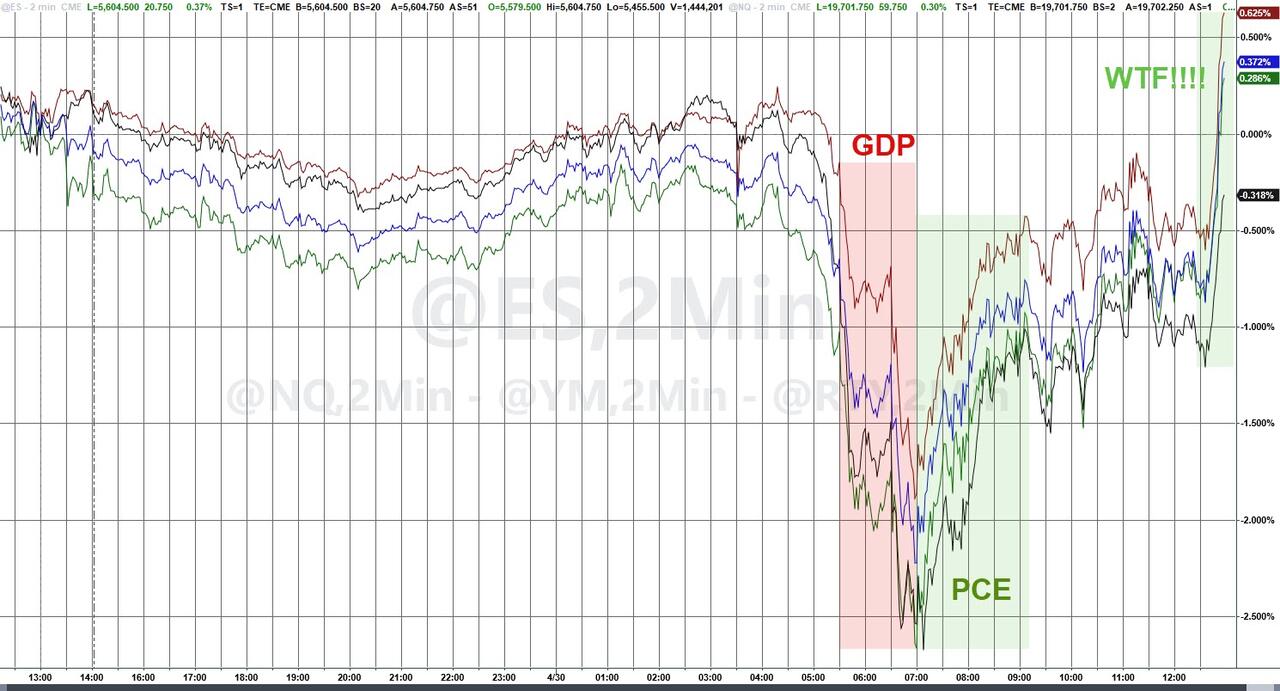
First-quarter GDP declined by 0.3%, a sharp reversal from the 2.4% increase in the fourth quarter. The Commerce Department report also showed a slowdown in consumer spending and a decline in government spending, the latter being a result of DOGE cuts.
A separate private payroll report from ADP signaled a slowdown in that sector, with private payrolls in April growing by only 62,000, well below the estimated 120,000. This dampened bullish sentiment, which had pulled the S&P 500 out of an 11% tailspin, leaving the index down only around 1% for the month.
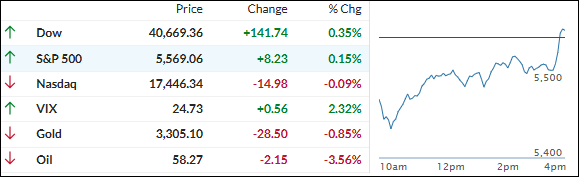
In the end, the Dow, and the S&P 500 managed to crawl back out of their early hole to close slightly in the green, helped by a last-hour melt-up. It was a choppy end to a choppy month, described by ZH as a 16% peak-to-trough drawdown followed by an 18% rally in the last few weeks.
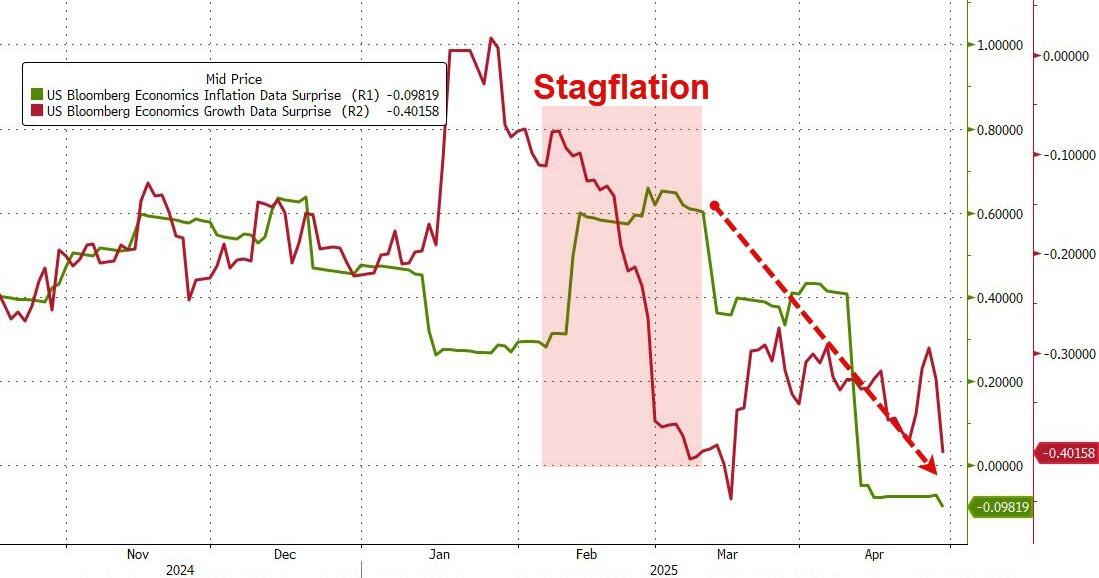
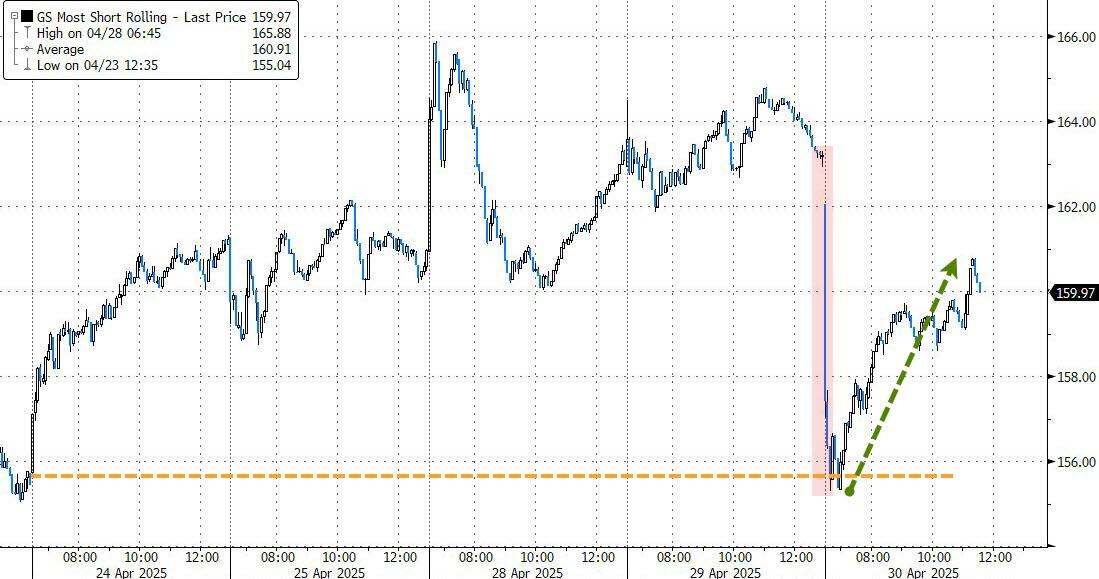
Growth and inflation data surprised to the downside, pushing the much-feared stagflation scenario to the back burner, at least for now. The most shorted stocks dumped after the opening but were squeezed higher as dip buyers stepped in.
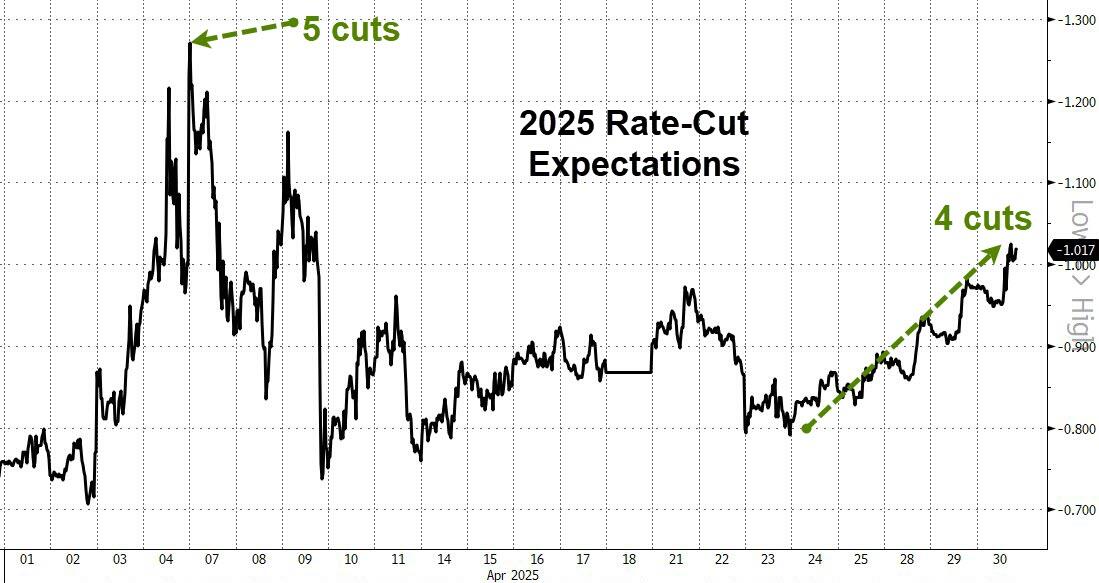
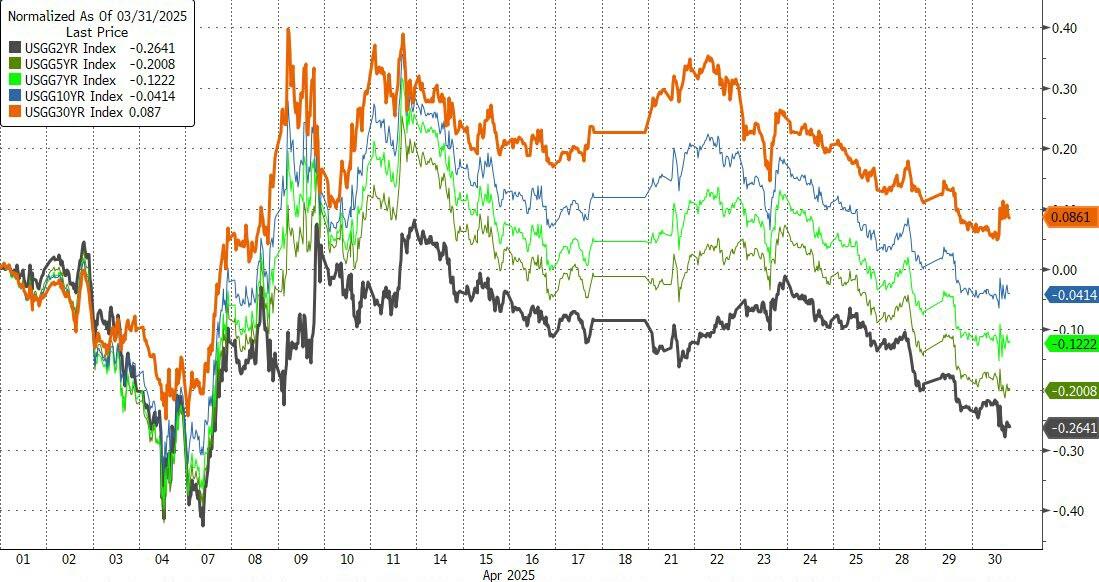
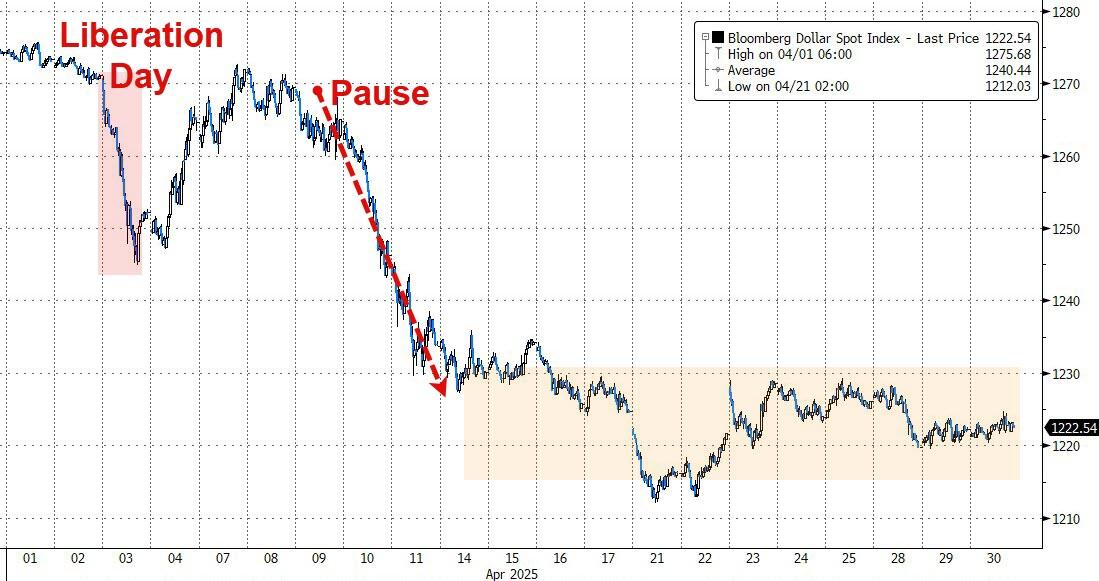
With weak macro data, it came as no surprise that rate-cut expectations surged while bond yields slipped. The dollar dropped over 4% during April, its worst performance since November 2022.
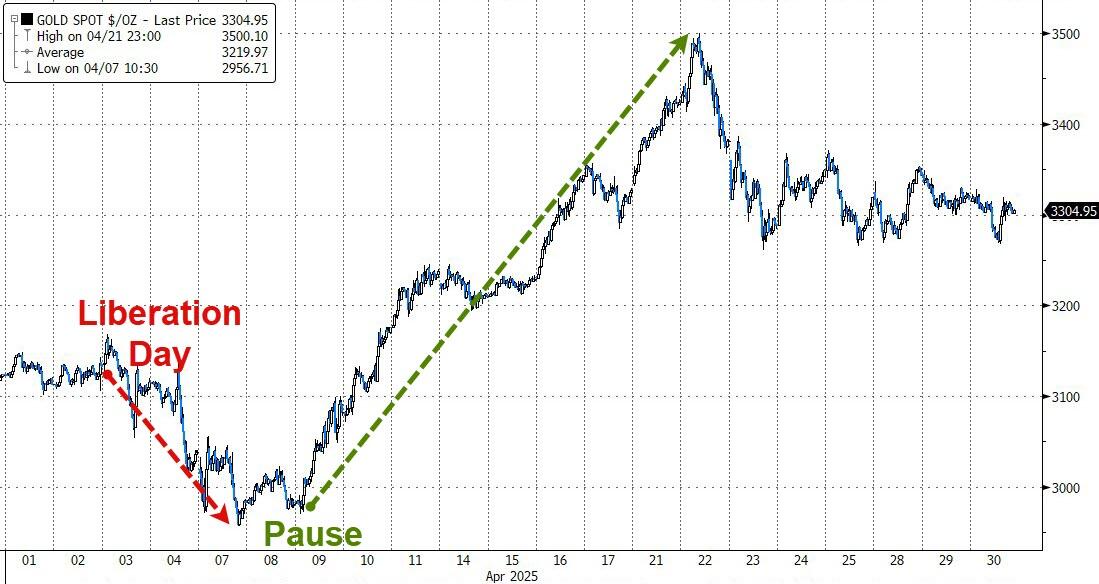
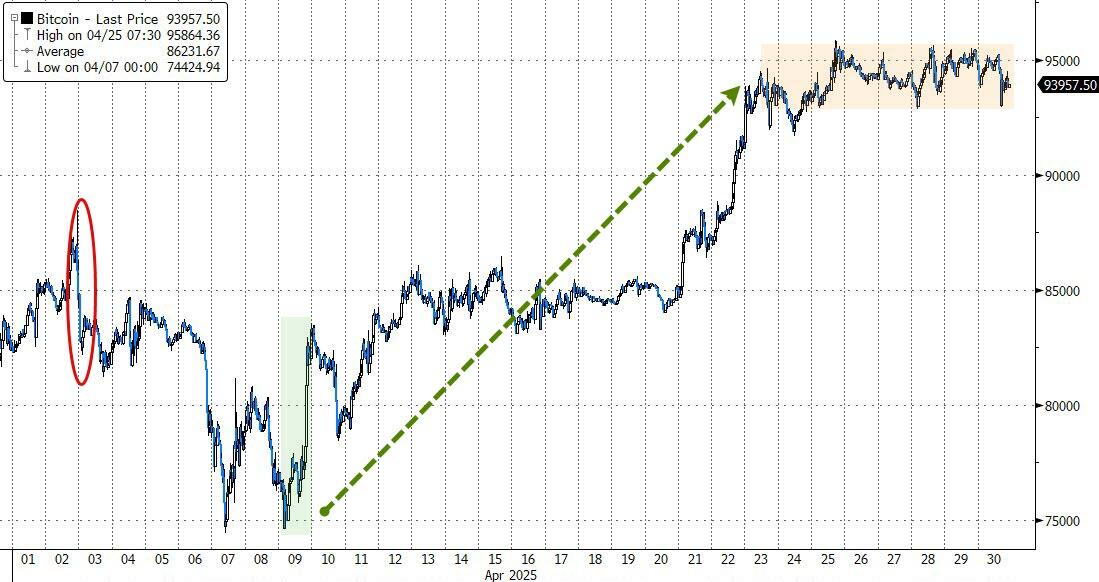
Gold moved in the opposite direction, gaining almost 6%, marking its fourth straight monthly rise, while Bitcoin rallied 14% for the month, its best performance since November, according to ZH.
It seems we are back to “bad news is good news,” as far as stocks are concerned, with bonds, crude oil, dropping U.S. inflation, and copper pointing to a recession, while rate-cut expectations are jumping higher along with equities.
2. Current “Sell” Cycle (effective 4/4/25)
Our domestic Buy cycle, which began on November 21, 2023, ended on April 3, 2025. The market reacted negatively to Trump’s tariff policy, causing major indexes and the broader market to drop sharply.
This confirmed the bearish trend that had been pushing our domestic TTI (Trend Tracking Index) below its trend line since March 10, 2025, but it wasn’t enough to end the Buy cycle until now. Consequently, we have exited the domestic market.
Meanwhile, our International TTI dropped sharply on April 4, 2025, generating a “Sell” signal. Since we did not have any exposure in international markets, we were not affected.
3. Trend Tracking Indexes (TTIs)
An early market drop provided an opportunity for dip buyers to step in and lift the markets out of their slump. All early losses were recovered, but month-over-month (MoM), the S&P 500 still ended slightly down.
Our TTIs were mixed, with the domestic indicator gaining slightly, while the international indicator dropped marginally.
This is how we closed 04/30/2025:
Domestic TTI: -3.29% below its M/A (prior close -3.43%)—Sell signal effective 4/4/25.
International TTI: +2.38% above its M/A (prior close +2.54%)—Sell signal effective 4/7/25.
All linked charts above are courtesy of Bloomberg via ZeroHedge.
———————————————————-
WOULD YOU LIKE TO HAVE YOUR INVESTMENTS PROFESSIONALLY MANAGED?
Do you have the time to follow our investment plans yourself? If you are a busy professional who would like to have his portfolio managed using our methodology, please contact me directly to get more details.
Contact Ulli