
ETF Tracker StatSheet
You can view the latest version here.
STOCKS AND BONDS SHOW STRONG WEEKLY PERFORMANCE DESPITE CHOPPY SESSION
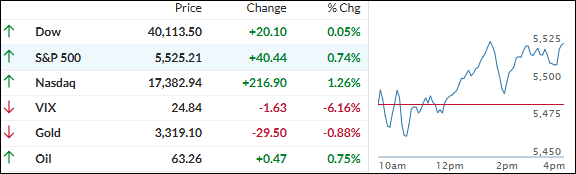
- Moving the market
Equities initially slipped but later recovered as traders weighed mixed earnings from major tech companies and the latest developments in the trade war.
Google parent Alphabet, part of the Mag7 stock basket, exceeded first-quarter earnings expectations, causing its stock to jump 2%. In contrast, Intel fell 7% after issuing disappointing guidance.
Bullish sentiment was further impacted by Trump’s comments in Time magazine, where he stated that he would consider it a “total victory” if the U.S. had high tariffs of 20% to 50% on foreign countries a year from now.
He also announced that many trade deals would be finalized in the next three to four weeks. However, there were no updates on China, which revealed that there were no ongoing discussions on tariffs, dampening market enthusiasm.
ZH described today’s session as choppy, range-bound, and quiet. Despite this, stocks and bonds showed strong performance for the week.
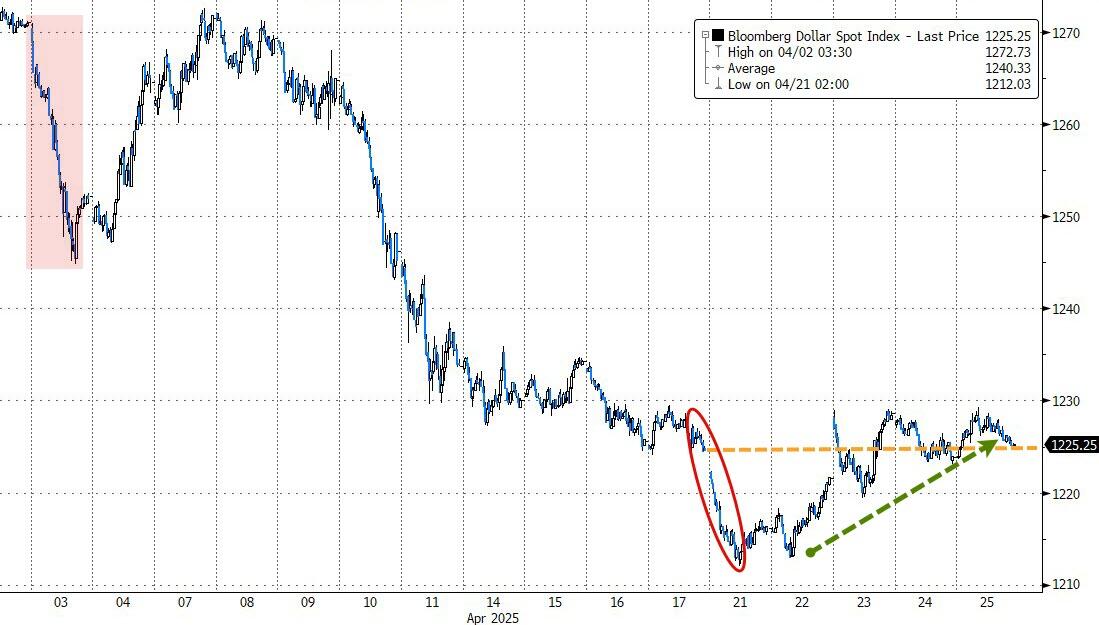
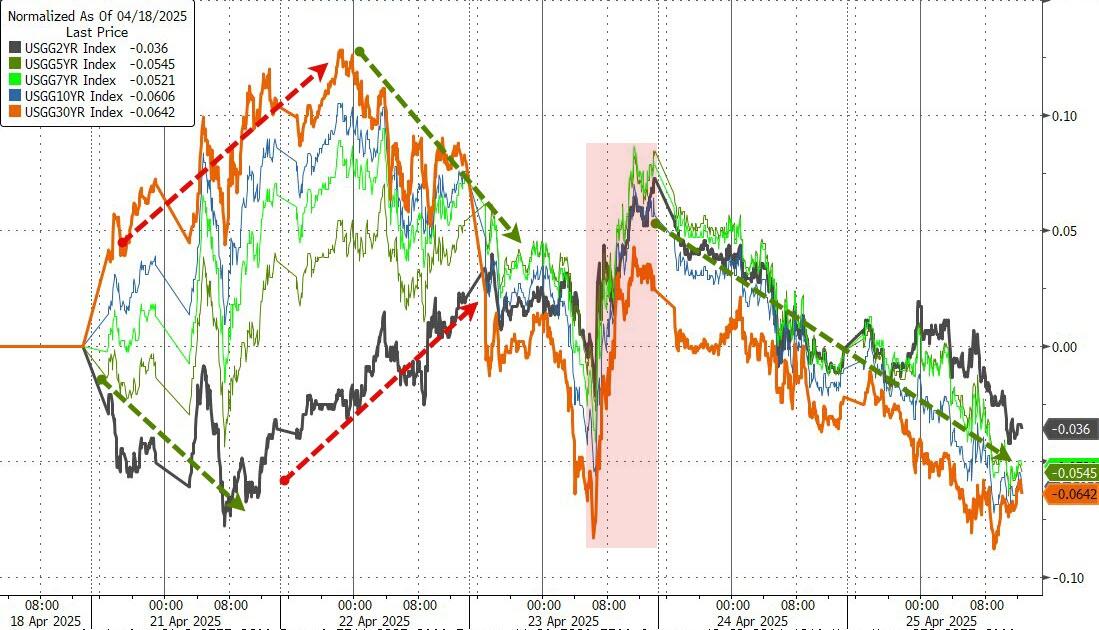
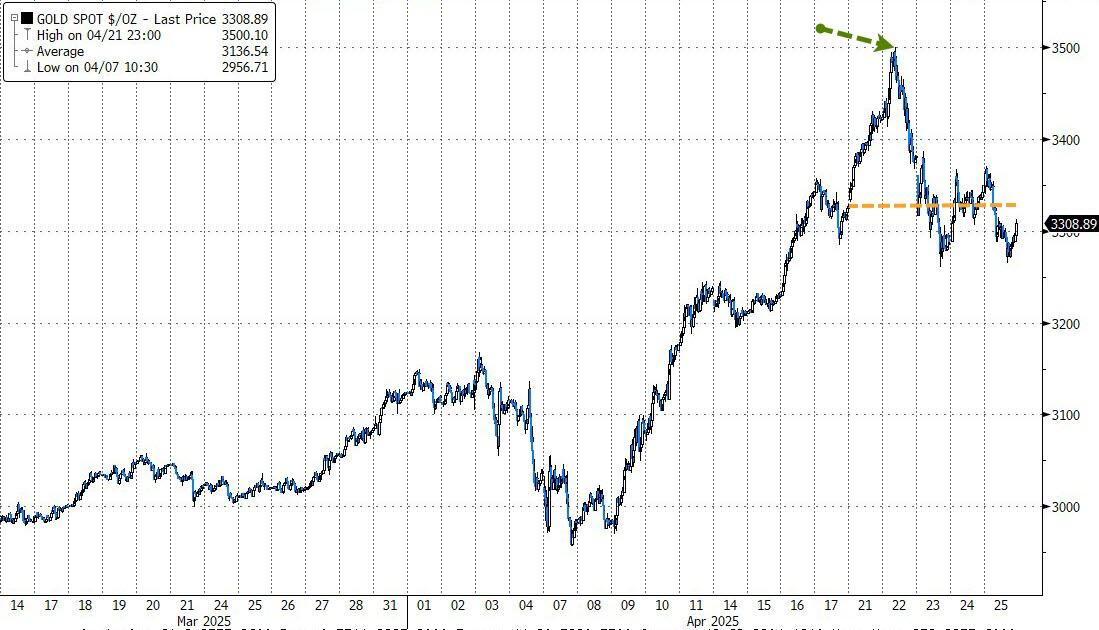
The dollar managed modest gains after two weeks of decline. Bond yields were lower this week, and gold experienced only its third down week of the year after reaching the $3,500 level, a pullback that was expected.
Bitcoin had a great week, touching $95,000 for the first time since February and breaking above key technical levels.
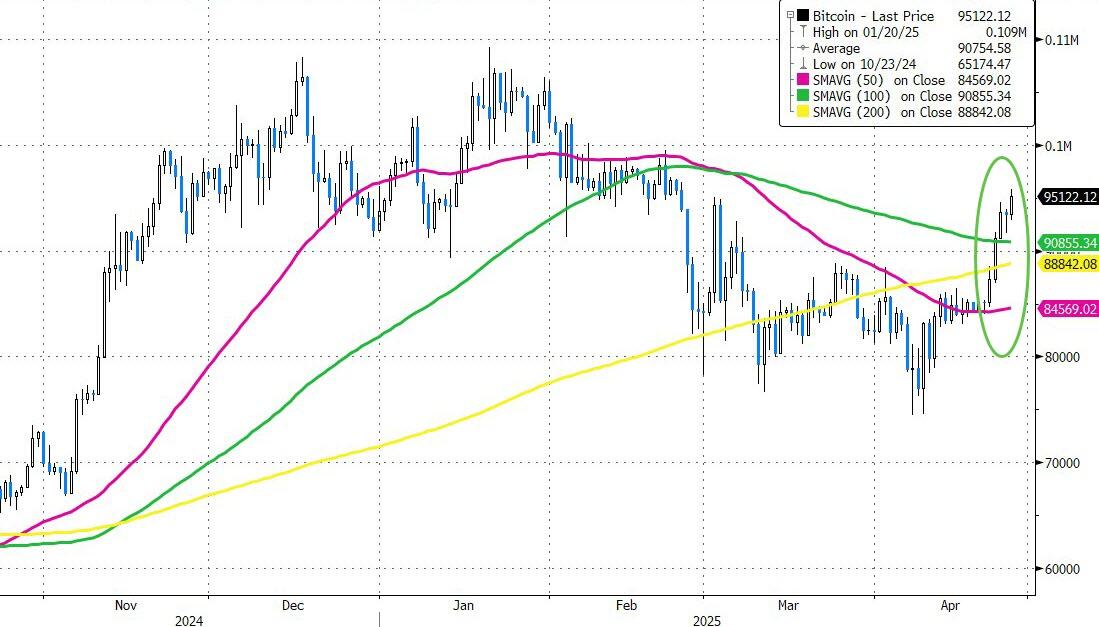
As I have repeatedly pointed out, Bitcoin appears to be in a bull run following global liquidity with a three-month lag.
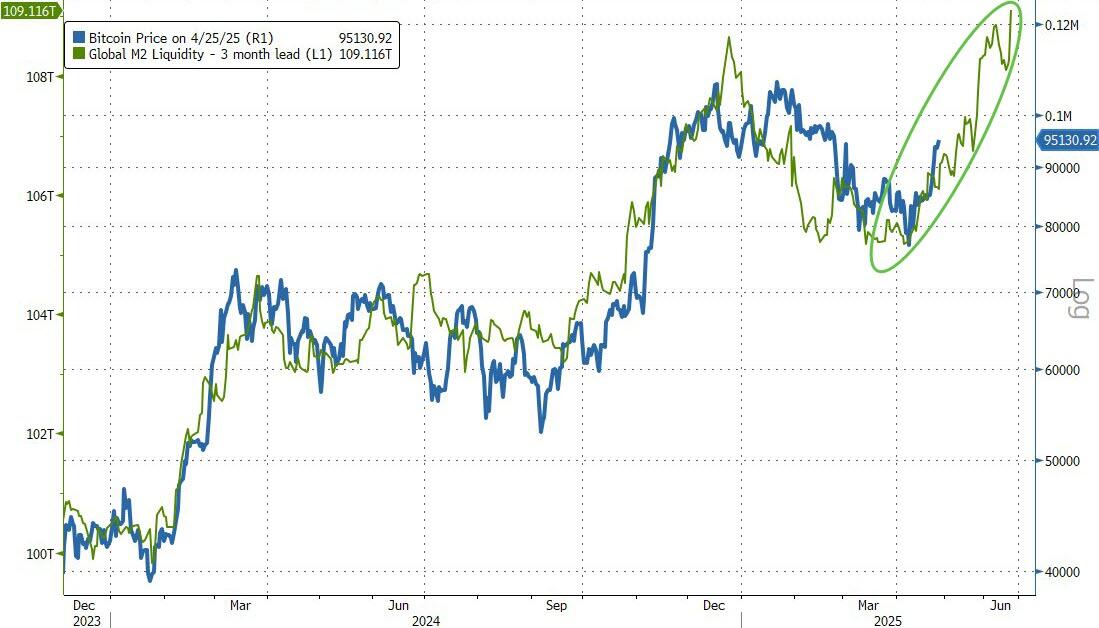
Will it catch up with gold’s year-to-date performance?
2. Current “Sell” Cycle (effective 4/4/25)
Our domestic Buy cycle, which began on November 21, 2023, ended on April 3, 2025. The market reacted negatively to Trump’s tariff policy, causing major indexes and the broader market to drop sharply.
This confirmed the bearish trend that had been pushing our domestic TTI (Trend Tracking Index) below its trend line since March 10, 2025, but it wasn’t enough to end the Buy cycle until now. Consequently, we have exited the domestic market.
Meanwhile, our International TTI dropped sharply on April 4, 2025, generating a “Sell” signal. Since we did not have any exposure in international markets, we were not affected.
3. Trend Tracking Indexes (TTIs)
This morning, the markets began with some volatility but managed to stabilize, ending the week on a positive note. The S&P 500 achieved five consecutive days of gains.
Our TTIs presented a mixed picture today: the domestic TTI declined, while the international TTI advanced. However, the international TTI still requires more consistent performance before a new “Buy” signal can be confirmed.
This is how we closed 04/25/2025:
Domestic TTI: -4.26% below its M/A (prior close -4.13%)—Sell signal effective 4/4/25.
International TTI: +1.33% above its M/A (prior close +1.19%)—Sell signal effective 4/7/25.
All linked charts above are courtesy of Bloomberg via ZeroHedge.
———————————————————-
WOULD YOU LIKE TO HAVE YOUR INVESTMENTS PROFESSIONALLY MANAGED?
Do you have the time to follow our investment plans yourself? If you are a busy professional who would like to have his portfolio managed using our methodology, please contact me directly to get more details.
Contact Ulli