
ETF Tracker StatSheet
You can view the latest version here.
GOLD SHINES AS EQUITIES SWING AND INFLATION HITS RECORD HIGHS
- Moving the market
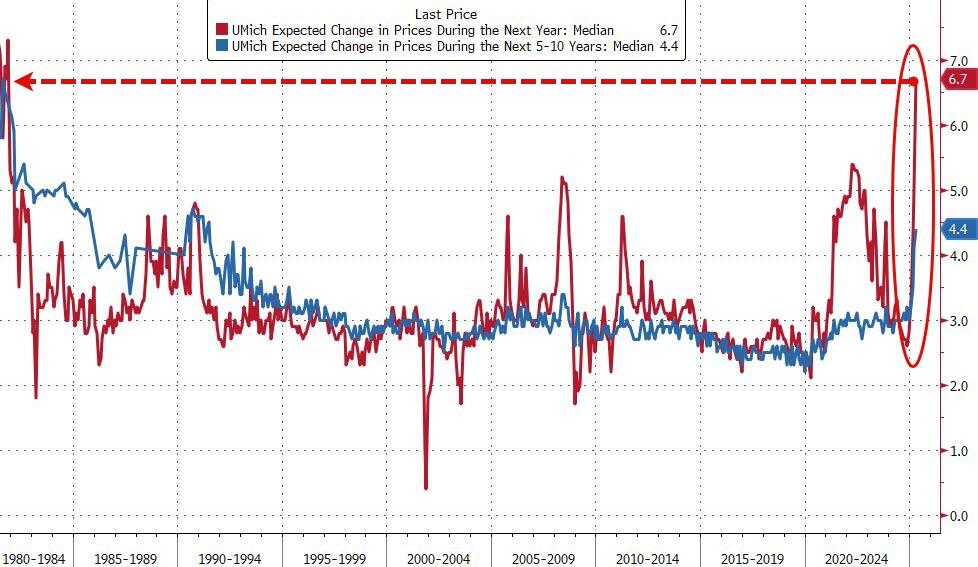
The stock market experienced another volatile opening, with equities swinging sharply due to worse-than-expected consumer sentiment for April. The index dropped from March’s 57.0 to 50.8, significantly below the expected 54.6.
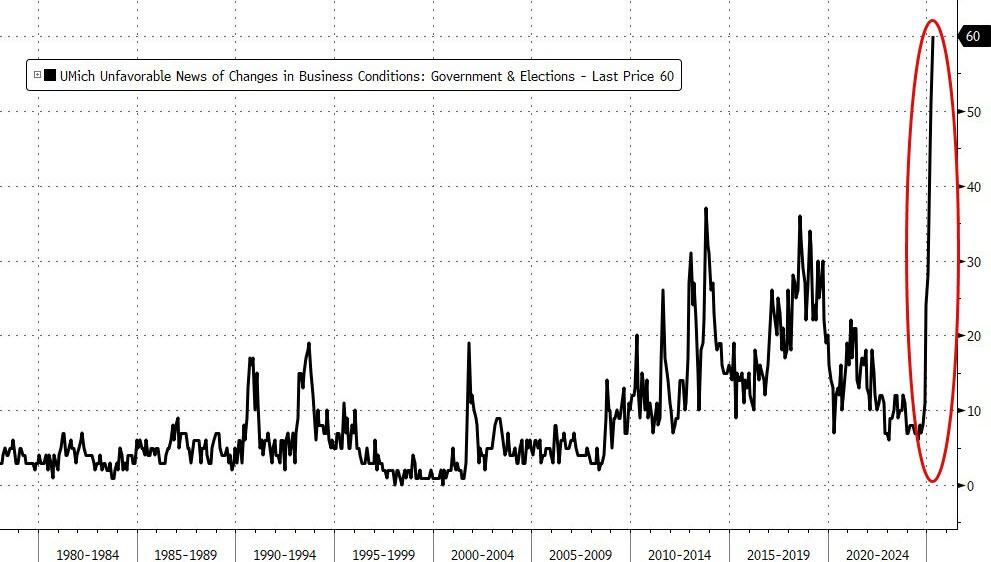
Inflation concerns surged, rising from 5% in March to 6.7% in April, marking the highest level since November 1981. Other survey measures also indicated deterioration.
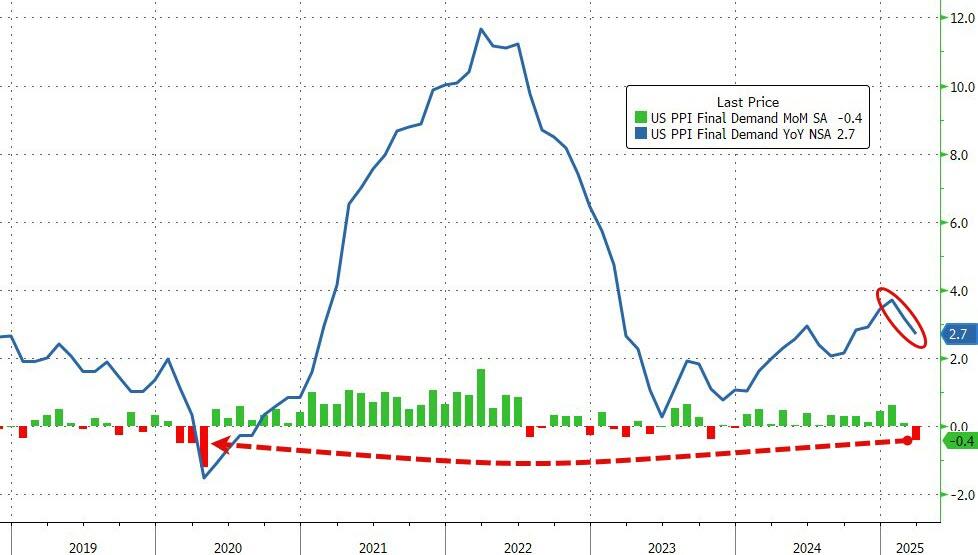
However, Producer Prices saw the largest drop since the COVID-19 pandemic, with a 0.4% month-over-month decrease, bringing the year-over-year index down to 2.7%.
This week has been one of the most volatile in Wall Street history. Trade policy uncertainties have caused major indexes to remain solidly in the red for 2025, despite a rebound this week.
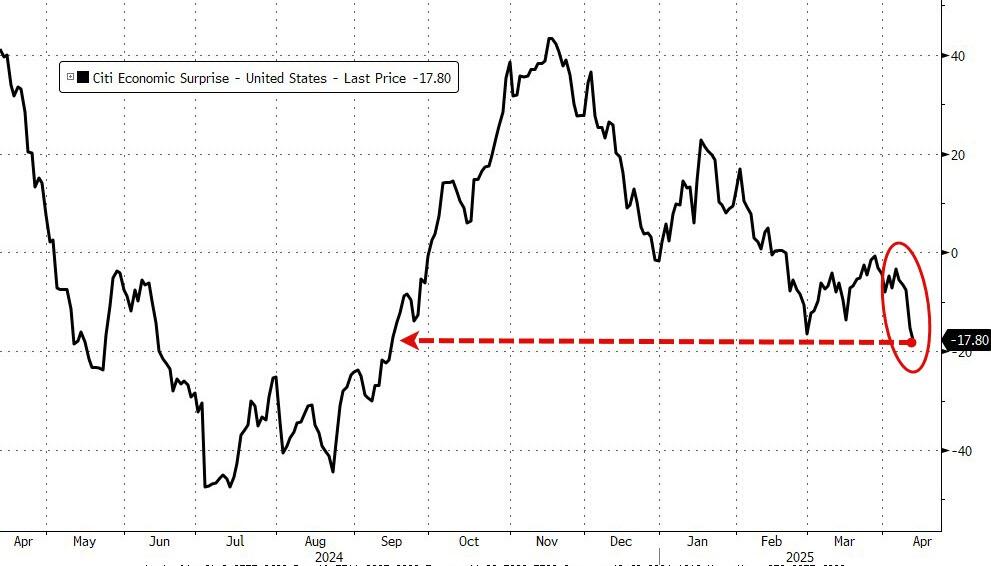
The US Macro Surprise Index, which had bounced off its lows in March, reversed and reached its weakest point since September. Financial conditions tightened dramatically, yet the Federal Reserve remained stoic and non-committal.
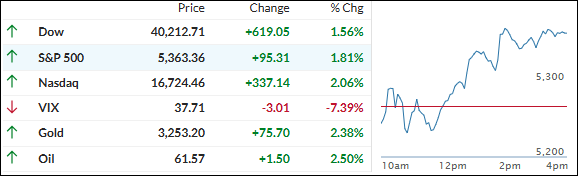
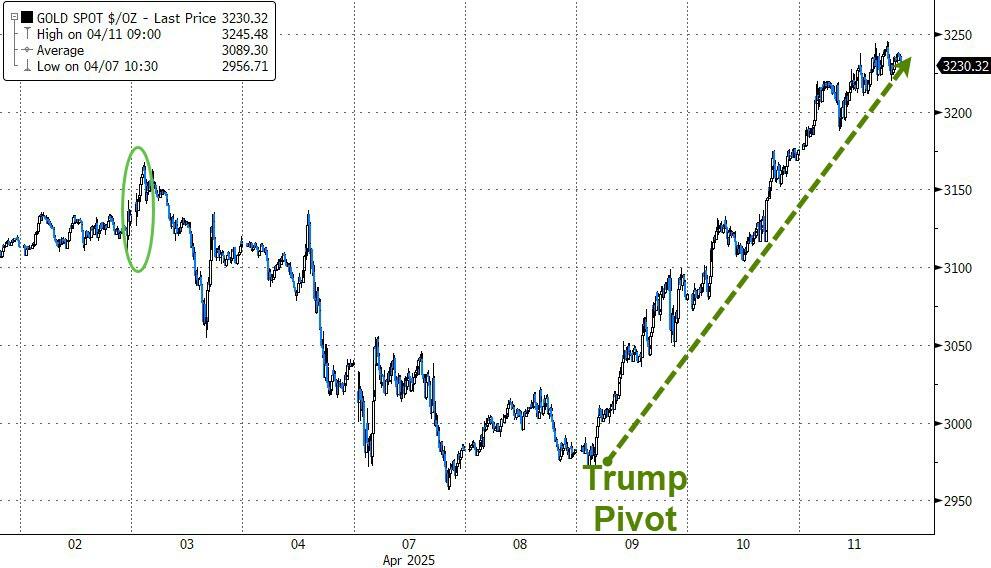
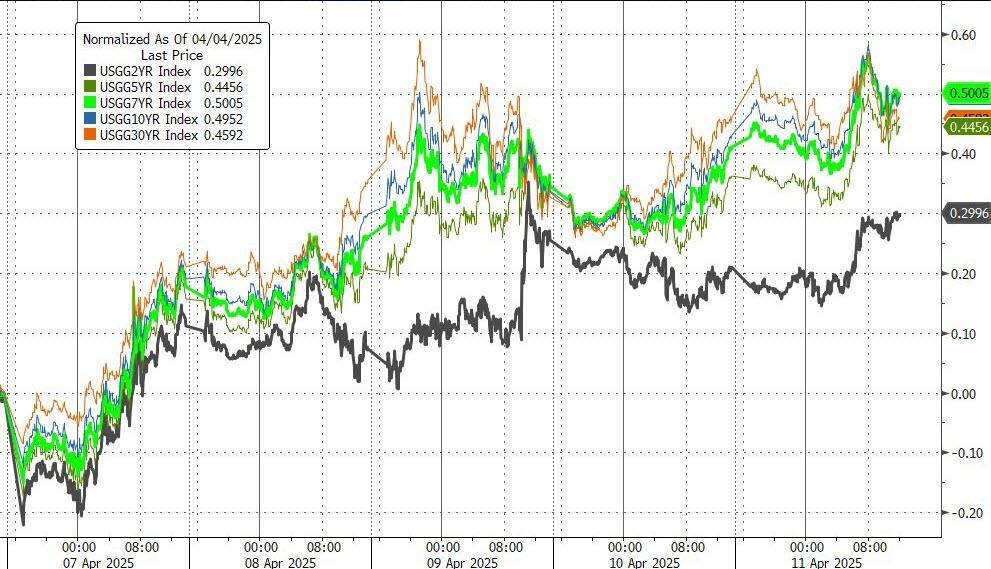
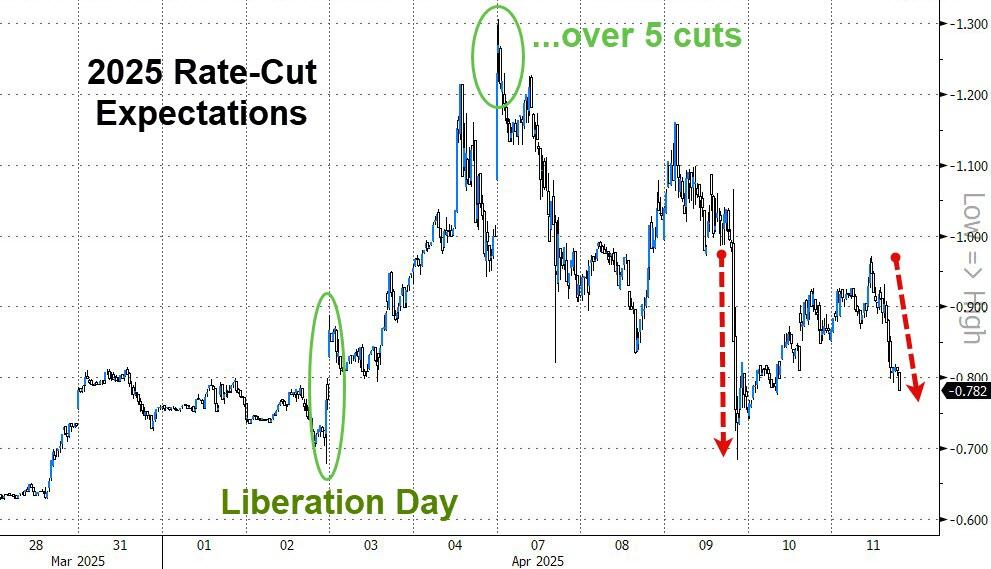
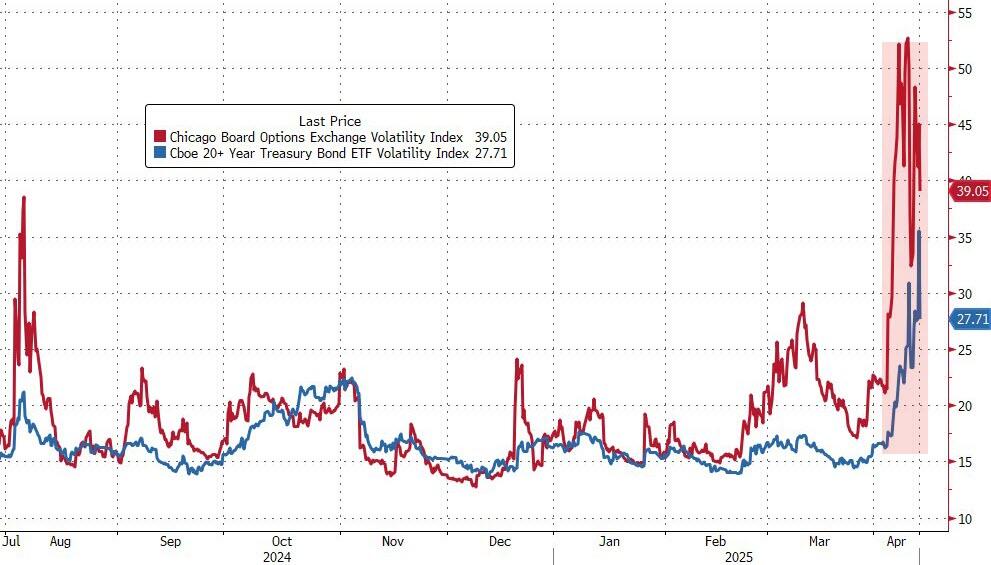
Gold emerged as the performance leader, achieving its best week since March 2020 amid rising bond yields. Rate-cut expectations plummeted as bond volatility surged, indicating underlying stress in the market.
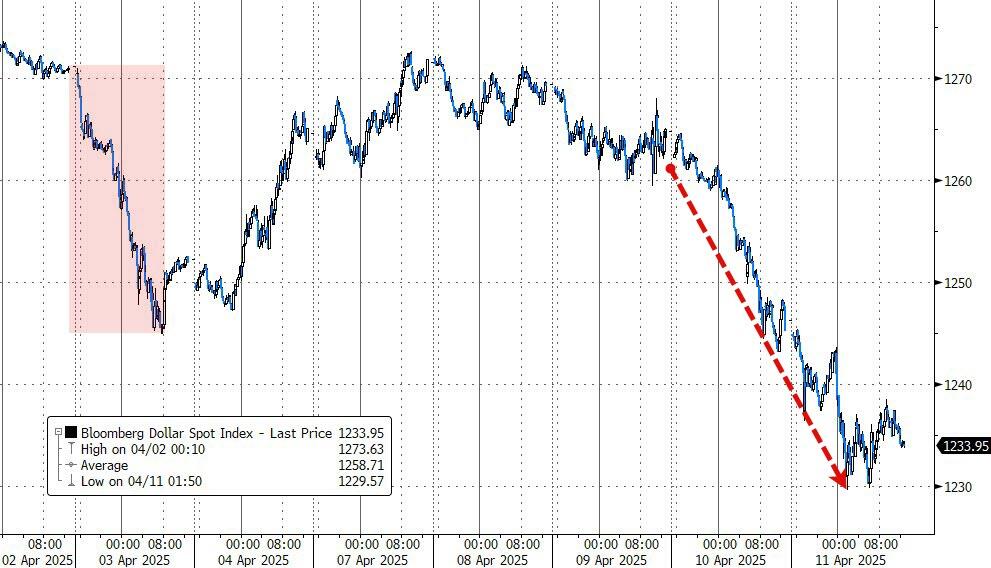
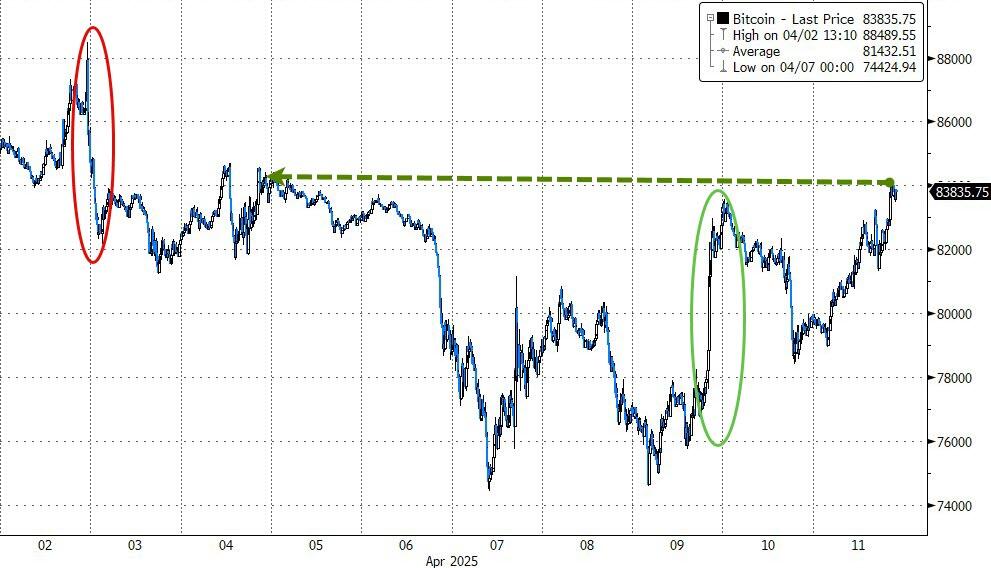
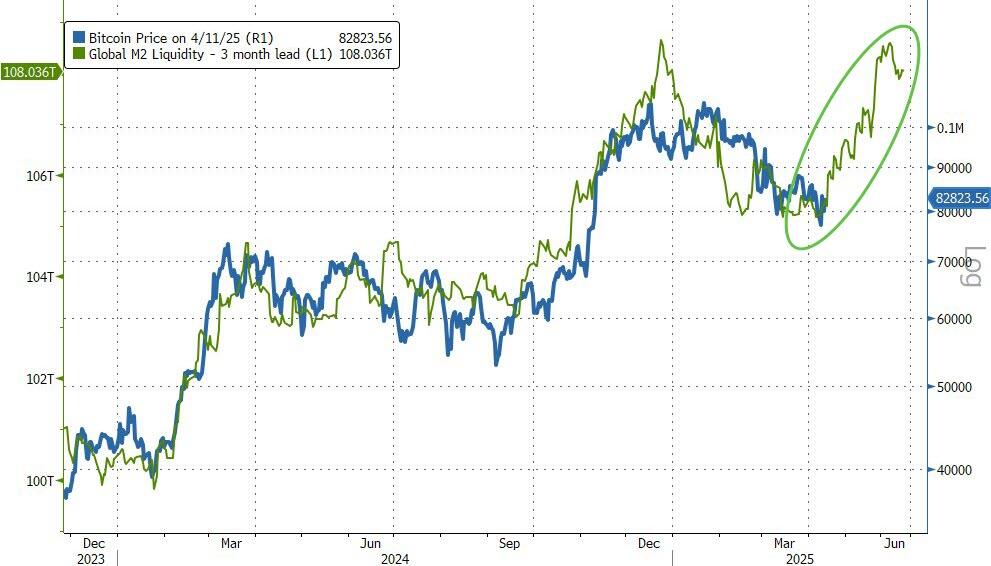
The dollar experienced its worst two-week drop since November 2022, while Bitcoin had its best week since early January, potentially entering a strong period if historical liquidity trends hold true.
2. Current “Sell” Cycle (effective 4/4/25)
Our domestic Buy cycle, which began on November 21, 2023, ended on April 3, 2025. The market reacted negatively to Trump’s tariff policy, causing major indexes and the broader market to drop sharply.
This confirmed the bearish trend that had been pushing our domestic TTI (Trend Tracking Index) below its trend line since March 10, 2025, but it wasn’t enough to end the Buy cycle until now. Consequently, we have exited the domestic market.
Meanwhile, our International TTI dropped sharply on April 4, 2025, generating a “Sell” signal. Since we did not have any exposure in international markets, we were not affected.
3. Trend Tracking Indexes (TTIs)
Hopes for a sustained rebound from yesterday were quickly dashed as the major indexes opened in the red and bullish sentiment failed to gain traction throughout the session.
Although equities managed to recover slightly from their intraday lows, they ultimately closed in negative territory.
Our TTIs showed mixed results: the international TTI saw a slight improvement, while the domestic TTI exhibited increased weakness.
This is how we closed 04/11/2025:
Domestic TTI: -7.42% below its M/A (prior close -8.86%)—Sell signal effective 4/4/25.
International TTI: -3.65% below its M/A (prior close -4.54%)—Sell signal effective 4/7/25.
All linked charts above are courtesy of Bloomberg via ZeroHedge.
———————————————————-
WOULD YOU LIKE TO HAVE YOUR INVESTMENTS PROFESSIONALLY MANAGED?
Do you have the time to follow our investment plans yourself? If you are a busy professional who would like to have his portfolio managed using our methodology, please contact me directly to get more details.
Contact Ulli