
- Moving the market
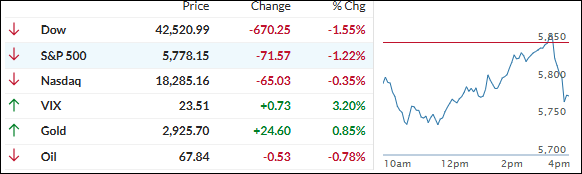
Equities continued their downward slide today as Trump’s tariffs on China, Mexico, and Canada went into effect. The affected countries announced retaliatory measures, sparking fears among traders of an all-out trade war and its potential negative economic impacts.
Monday’s market drop pushed the widely followed S&P 500 into the red for the year, with losses deepening today as hopes for a last-minute deal to avoid these confrontations faded.
Given the current economic conditions, as indicated by the deteriorating macro index, equities are likely to face a rough ride unless the tariff situation proves to be more of a negotiation tactic than an enduring trade war.
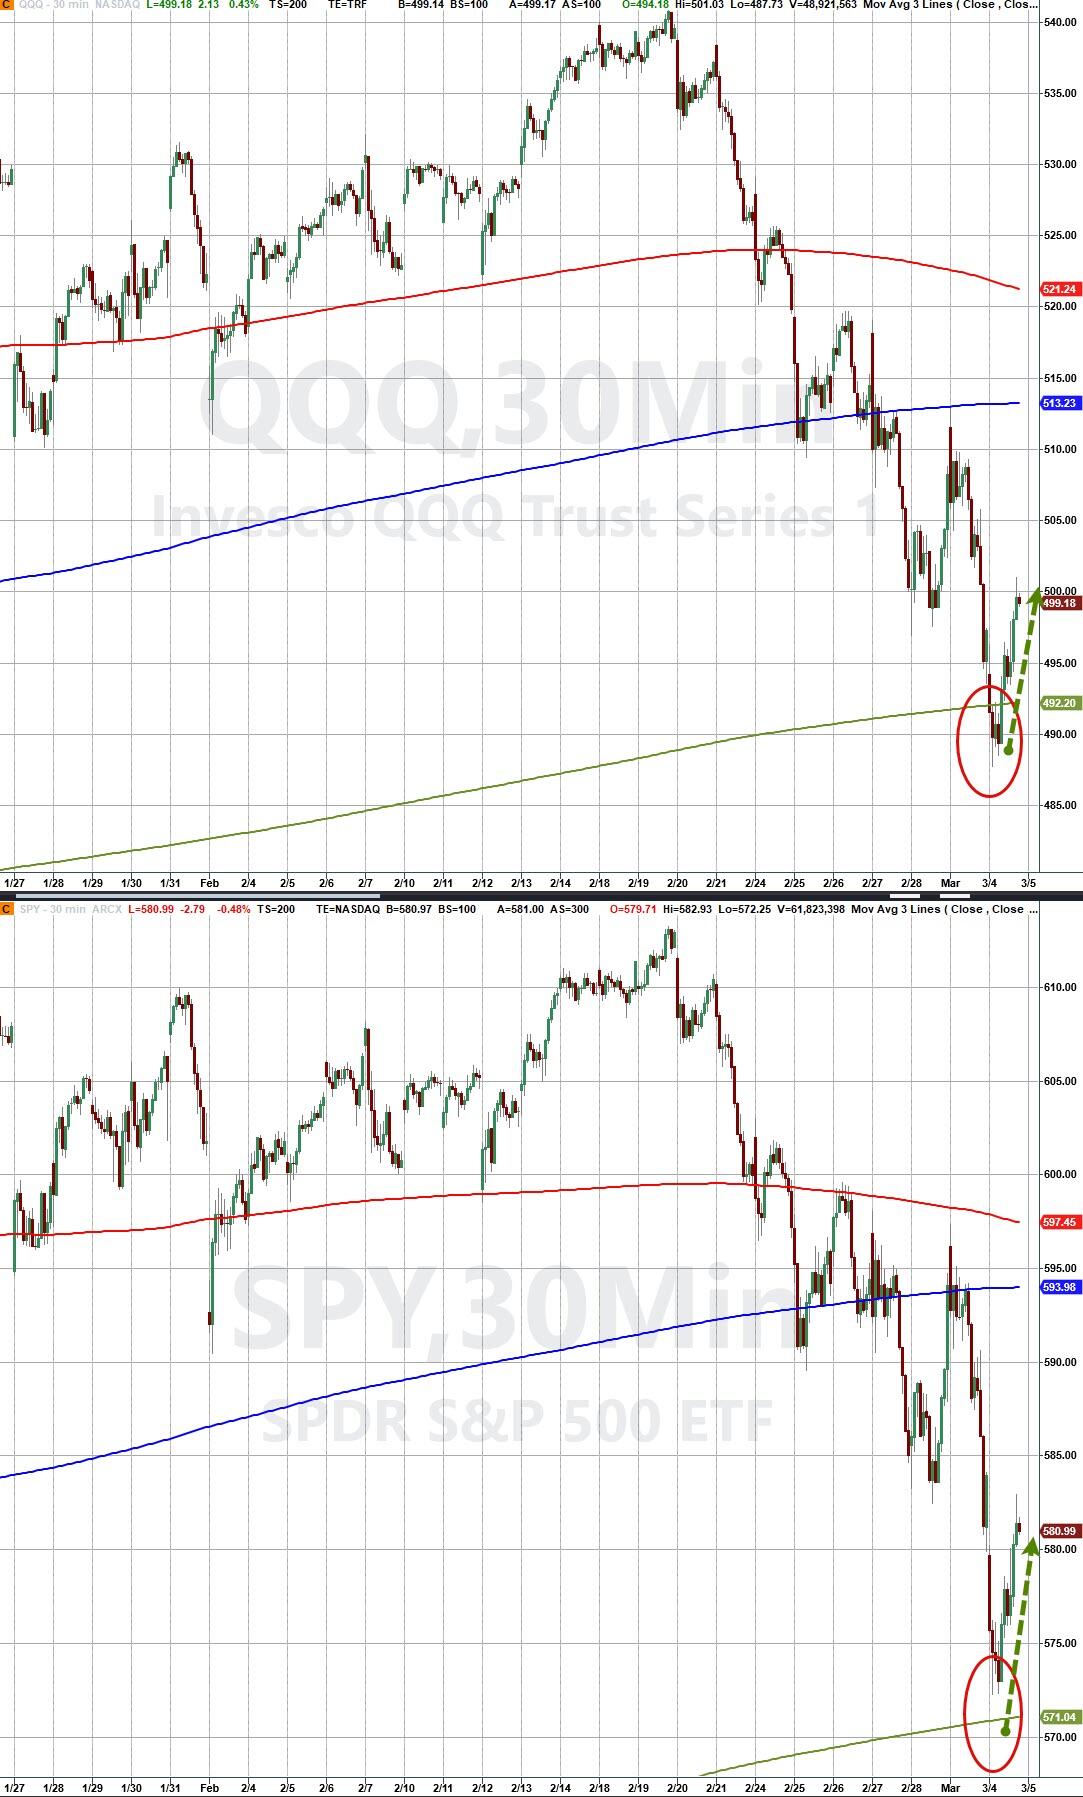
A mid-day rebound saw the S&P 500 and Nasdaq bounce off their respective 200-day moving averages and into positive territory. However, this attempt failed, and the major indexes reversed course, closing in the red but off their morning lows, with the Dow leading the decline.
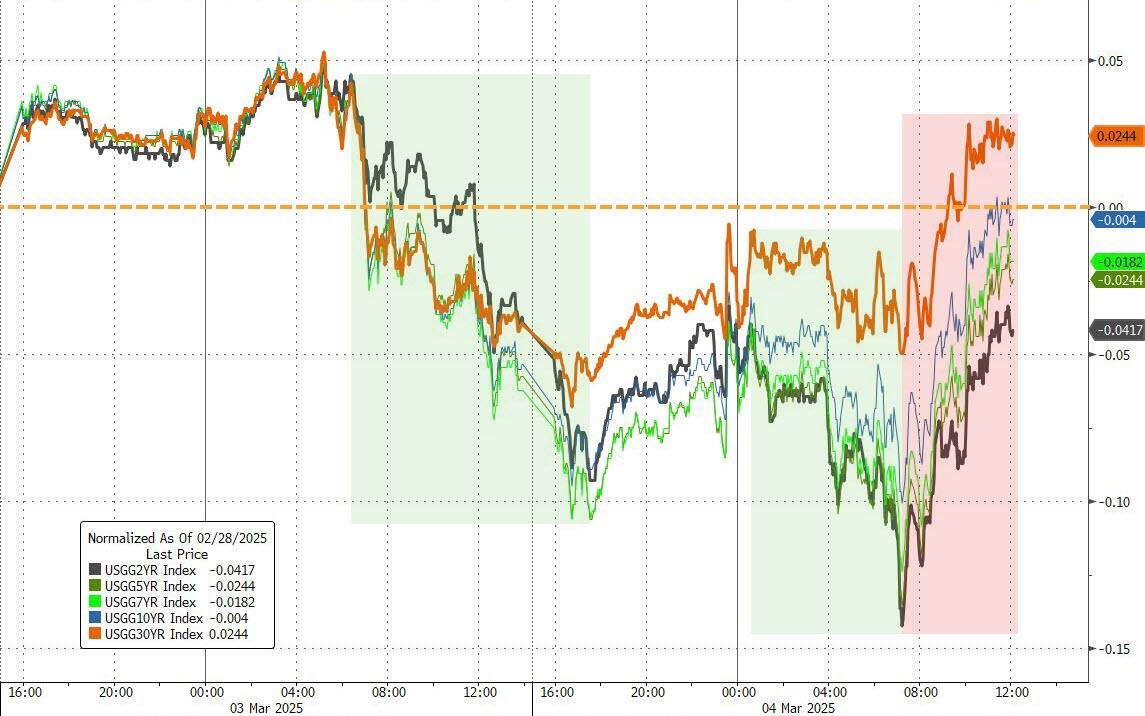
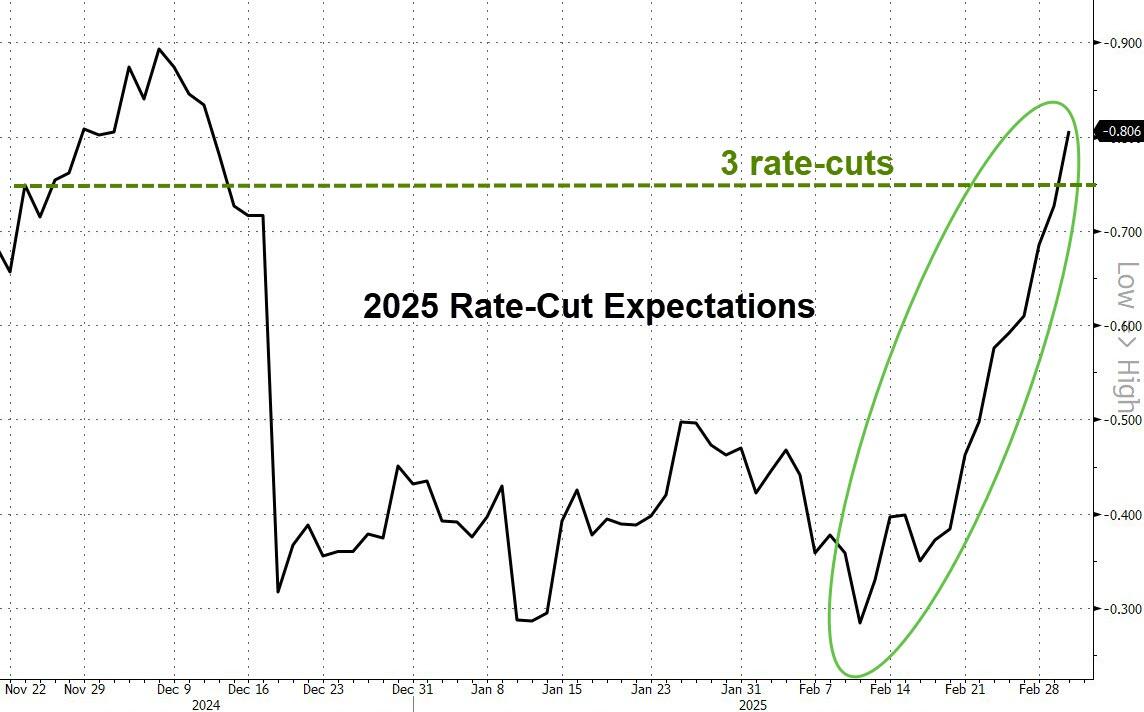
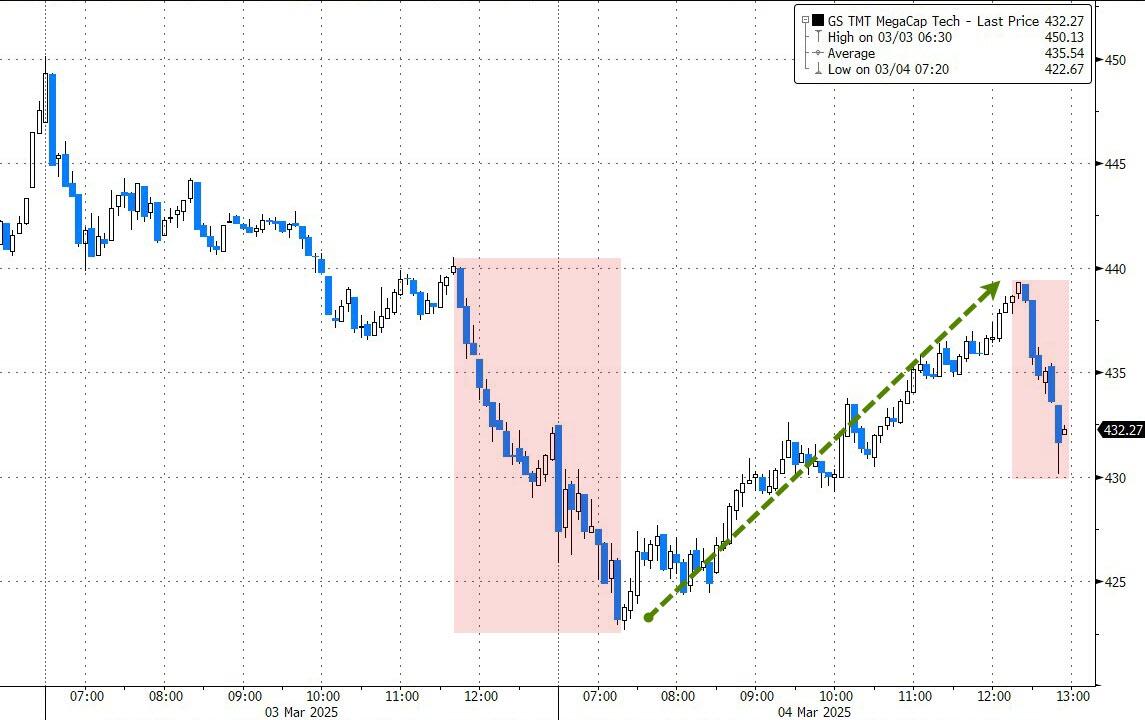
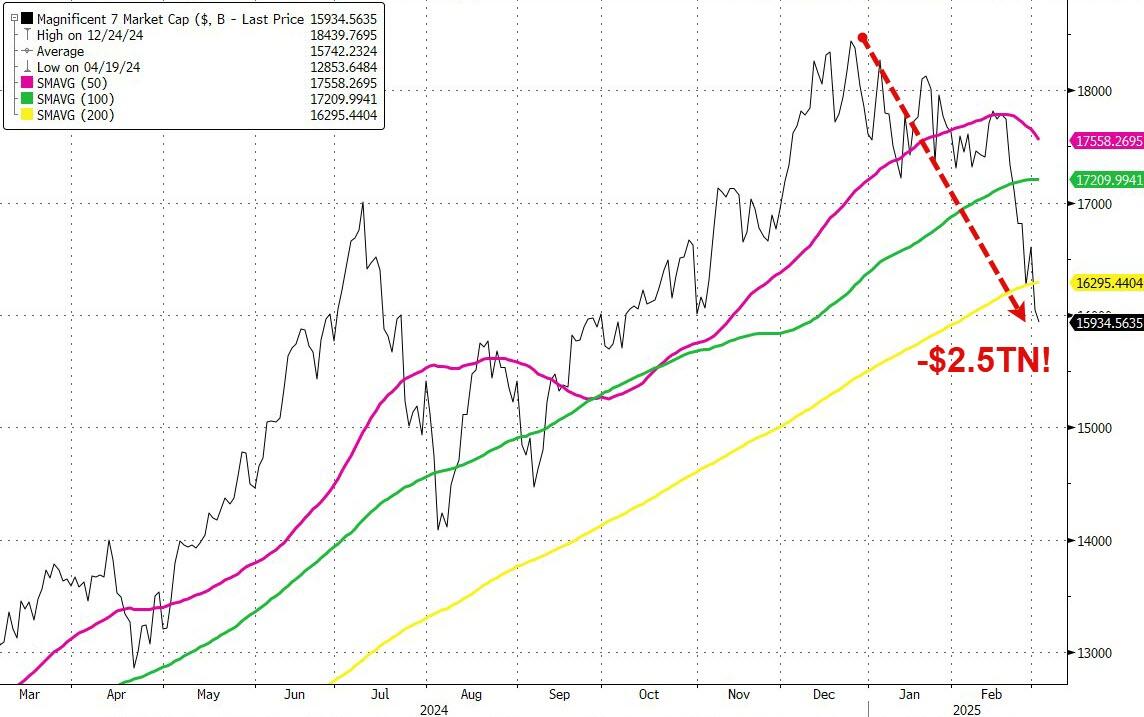
Bond yields were mixed, but expectations for rate cuts in 2025 soared to three. Big Tech experienced its own rollercoaster ride, with significant fluctuations throughout the day. The Mag7 basket saw a $2.5 trillion swing in market cap from highs to lows.
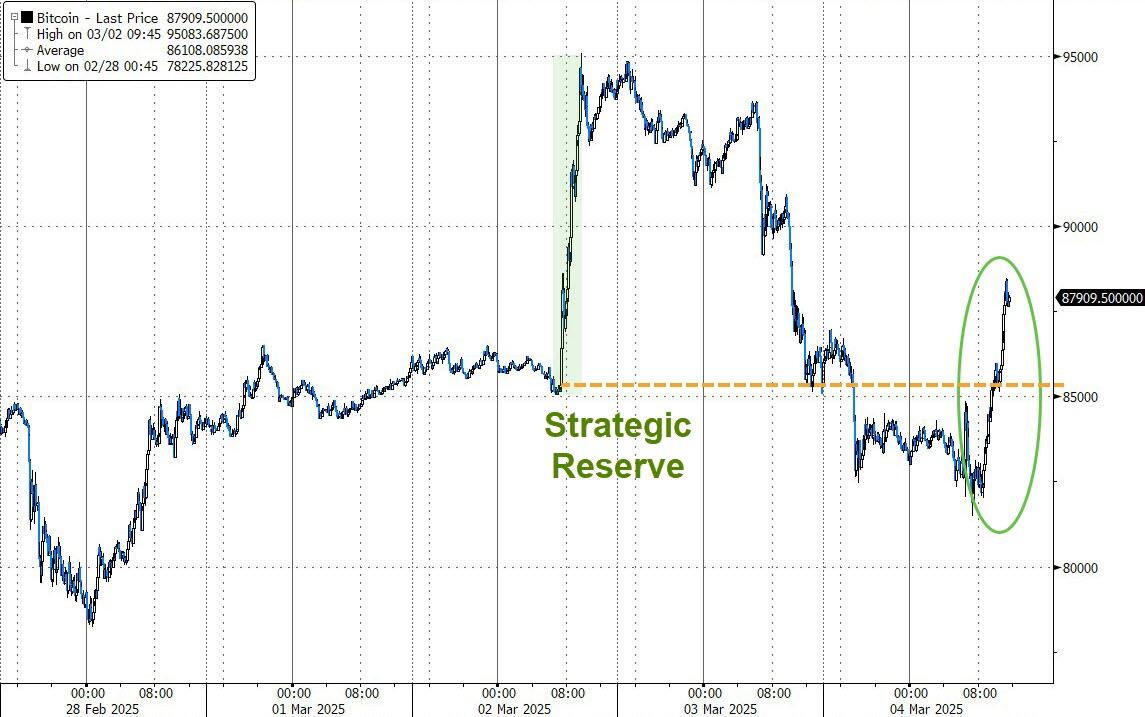
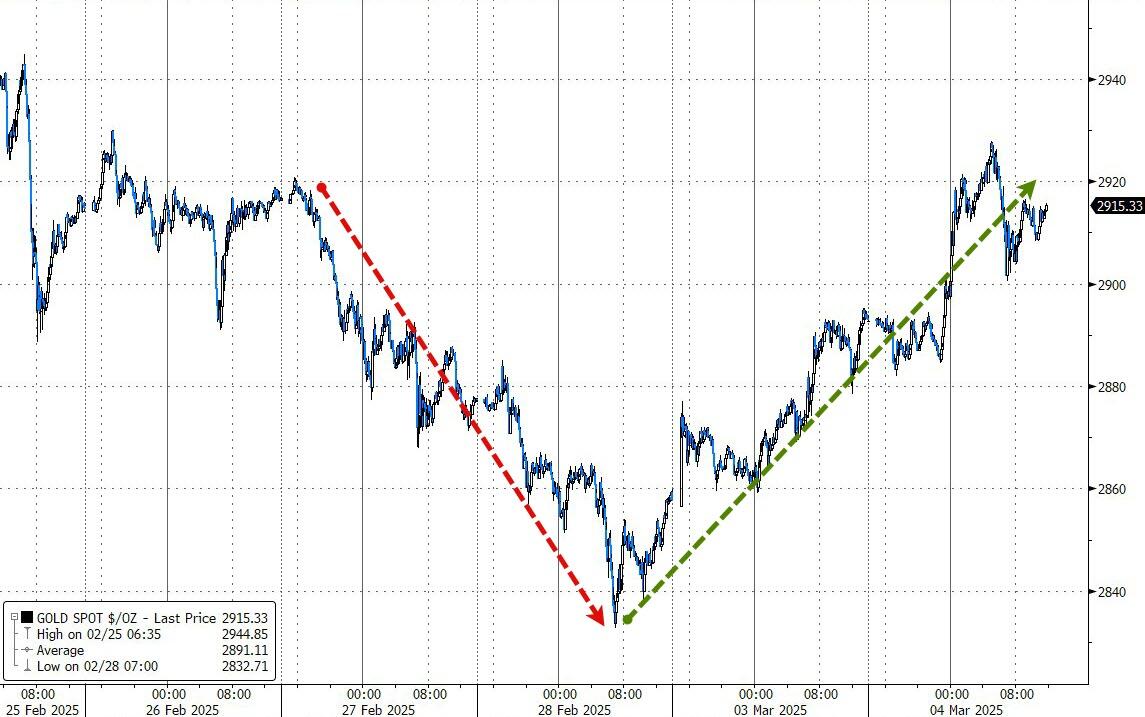
Bitcoin and gold provided some relief, with Bitcoin bouncing back strongly and gold trending higher with only minor dips.
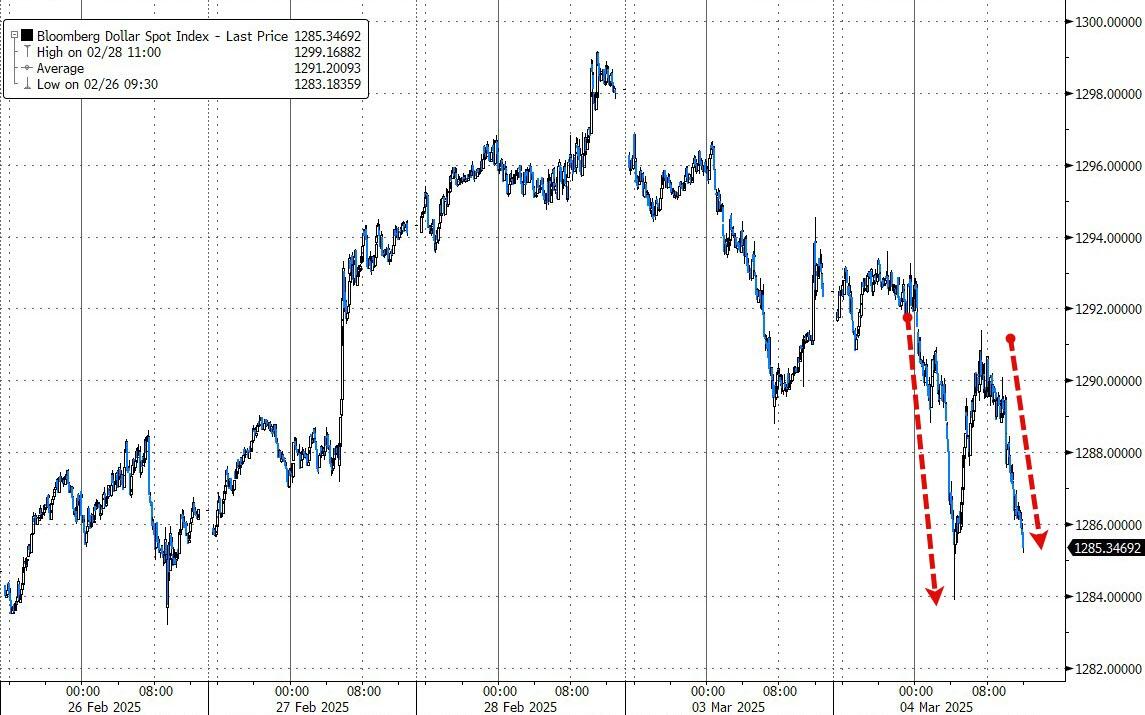
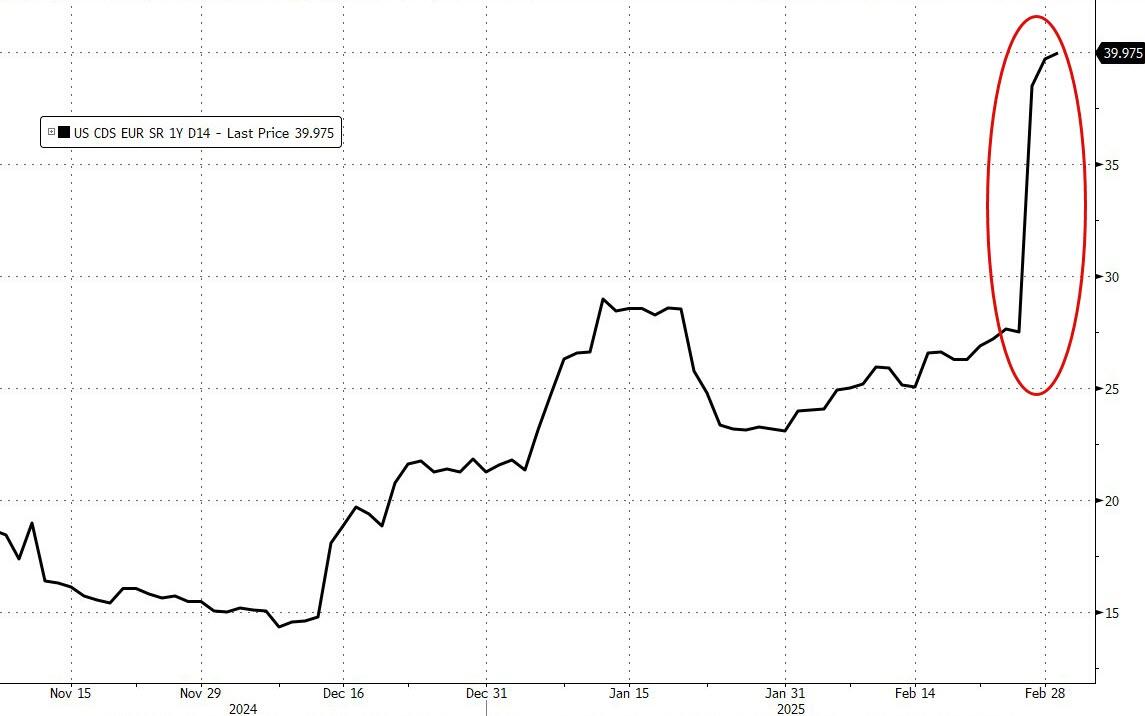
The dollar ended lower, and with a potential government shutdown looming, the risk of a U.S. sovereign default is once again rising, as highlighted by ZH.
To say we are living in interesting times seems to be an understatement.
2. Current “Buy” Cycles (effective 11/21/2023)
Our Trend Tracking Indexes (TTIs) have both crossed their trend lines with enough strength to trigger new “Buy” signals. That means, Tuesday, 11/21/2023, was the official date for these signals.
If you want to follow our strategy, you should first decide how much you want to invest based on your risk tolerance (percentage of allocation). Then, you should check my Thursday StatSheet and Saturday’s “ETFs on the Cutline” report for suitable ETFs to buy.
3. Trend Tracking Indexes (TTIs)
Equities suffered significant volatility today. After recovering from early losses, they declined again in the late session, closing solidly in the red.
Our Trend Tracking Indexes (TTIs) also fell, with the domestic TTI now at +0.26%, nearing its trend line on the downside. If it crosses this line, it will trigger a Sell signal for all “broadly diversified domestic equity ETFs and mutual funds.”
However, to avoid a whipsaw signal, I will wait for the index to show some staying power below the trend line before issuing a Sell recommendation.
For those of you tracking the market independently, be sure to check in daily for updates.
This is how we closed 03/04/2025:
Domestic TTI: +0.26% above its M/A (prior close +1.90%)—Buy signal effective 11/21/2023.
International TTI: +4.67% above its M/A (prior close +6.48%)—Buy signal effective 11/21/2023.
All linked charts above are courtesy of Bloomberg via ZeroHedge.
———————————————————-
WOULD YOU LIKE TO HAVE YOUR INVESTMENTS PROFESSIONALLY MANAGED?
Do you have the time to follow our investment plans yourself? If you are a busy professional who would like to have his portfolio managed using our methodology, please contact me directly to get more details.
Contact Ulli