
- Moving the market
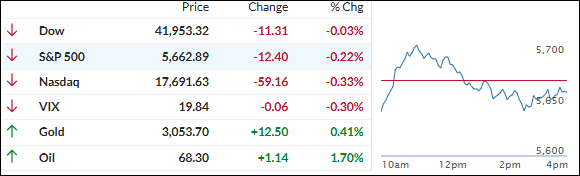
Equities continued their recovery from the recent selloff, buoyed by some positive economic data.
However, late-session uncertainties led to a red close for the major indexes, as concerns grew that the Fed might not be able to significantly cut rates in 2025 due to potentially inflationary trade tariffs starting on “Liberation Day,” April 2nd.
Some traders believe these economic concerns are exaggerated. Fed Chair Powell stated that the economy is “strong overall” and that his policy is “in a good place” to respond to any signs of weakness. He also described the potentially inflationary effects of tariffs as temporary.
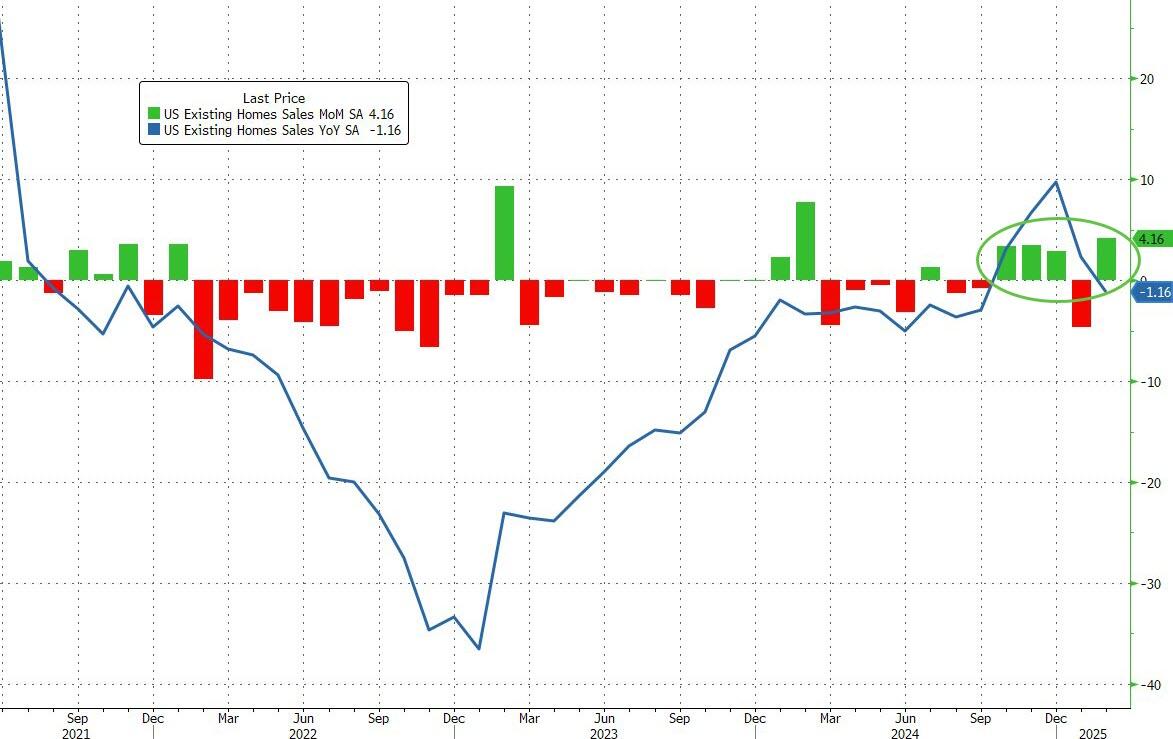
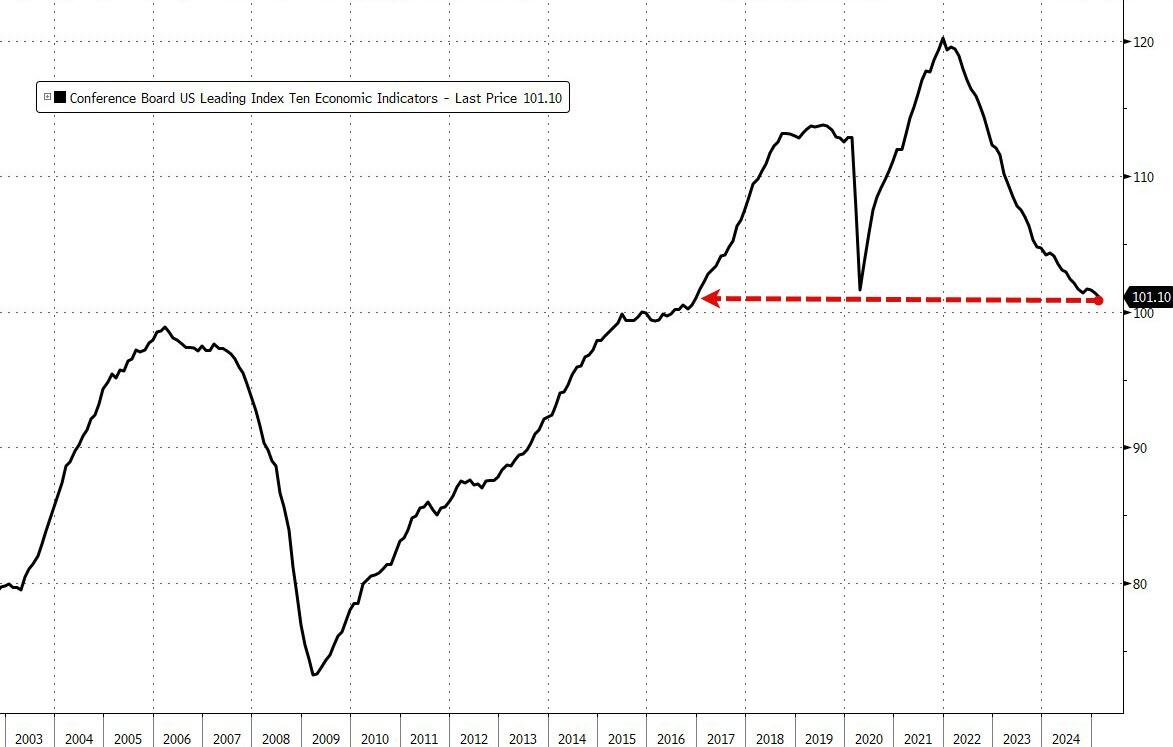
Sales of existing homes in February rose 4.2% from January, defying expectations of a 3% drop. Jobless claims increased only slightly from last week, with layoffs remaining low. However, Leading Indicators fell to their lowest level since November 2016, as noted by ZH.
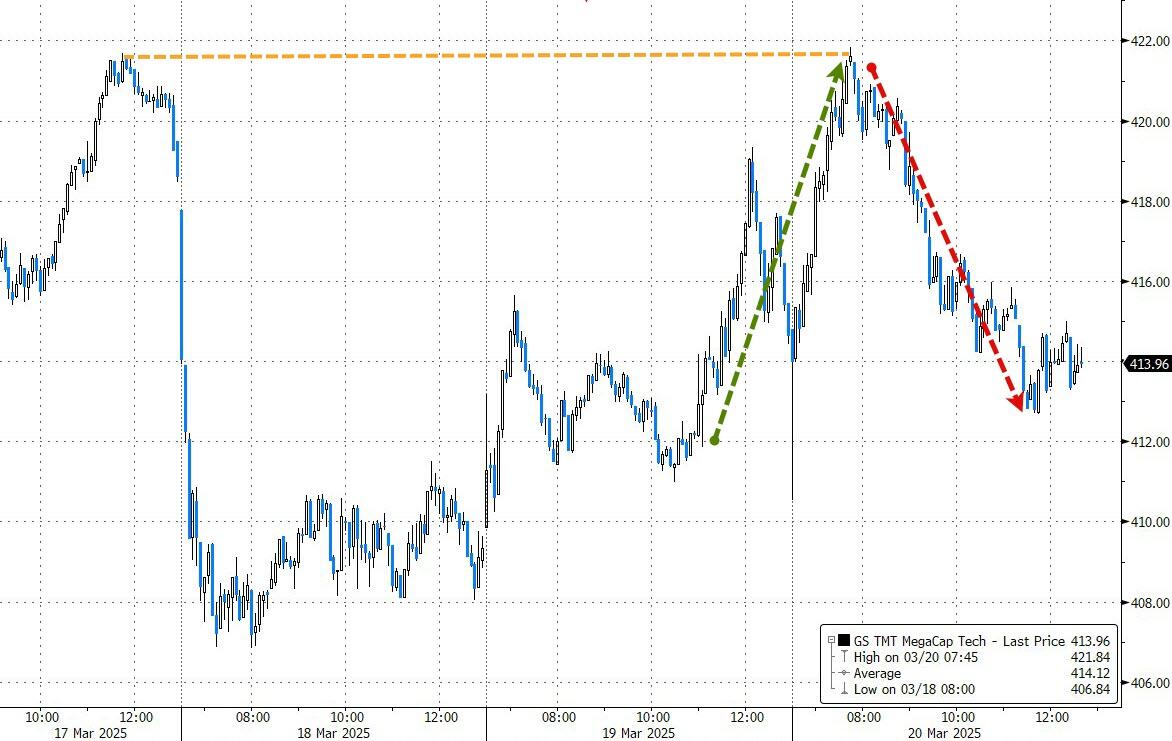
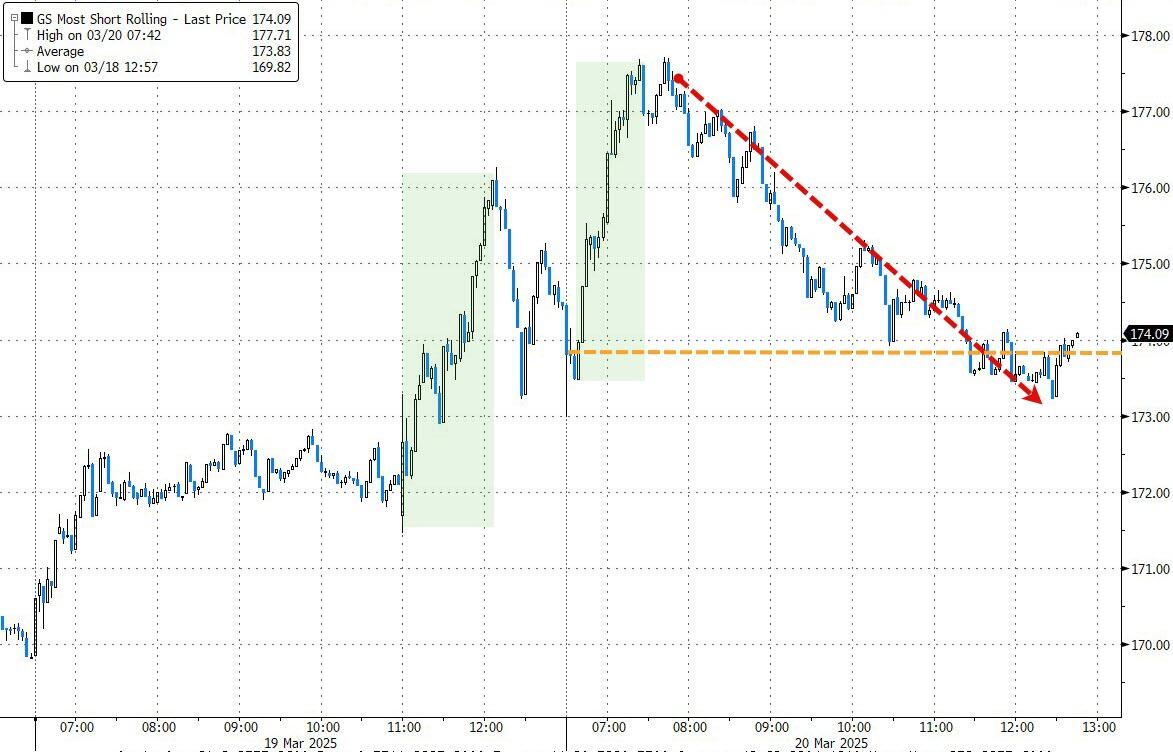
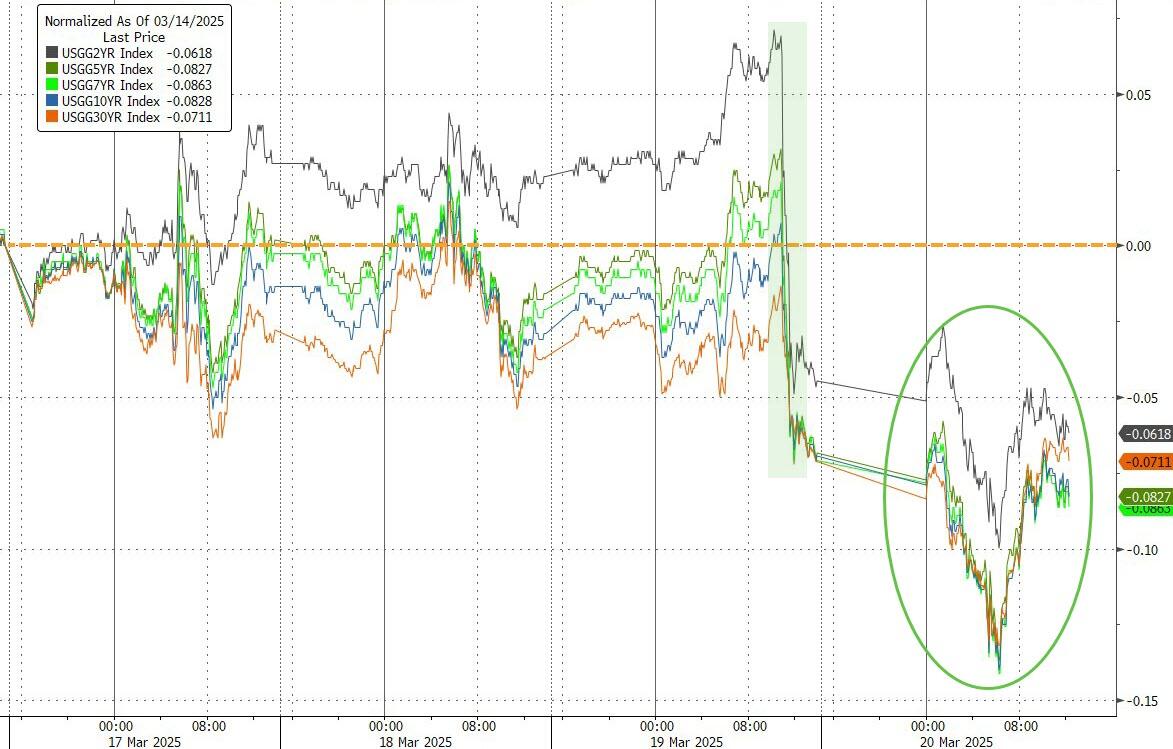
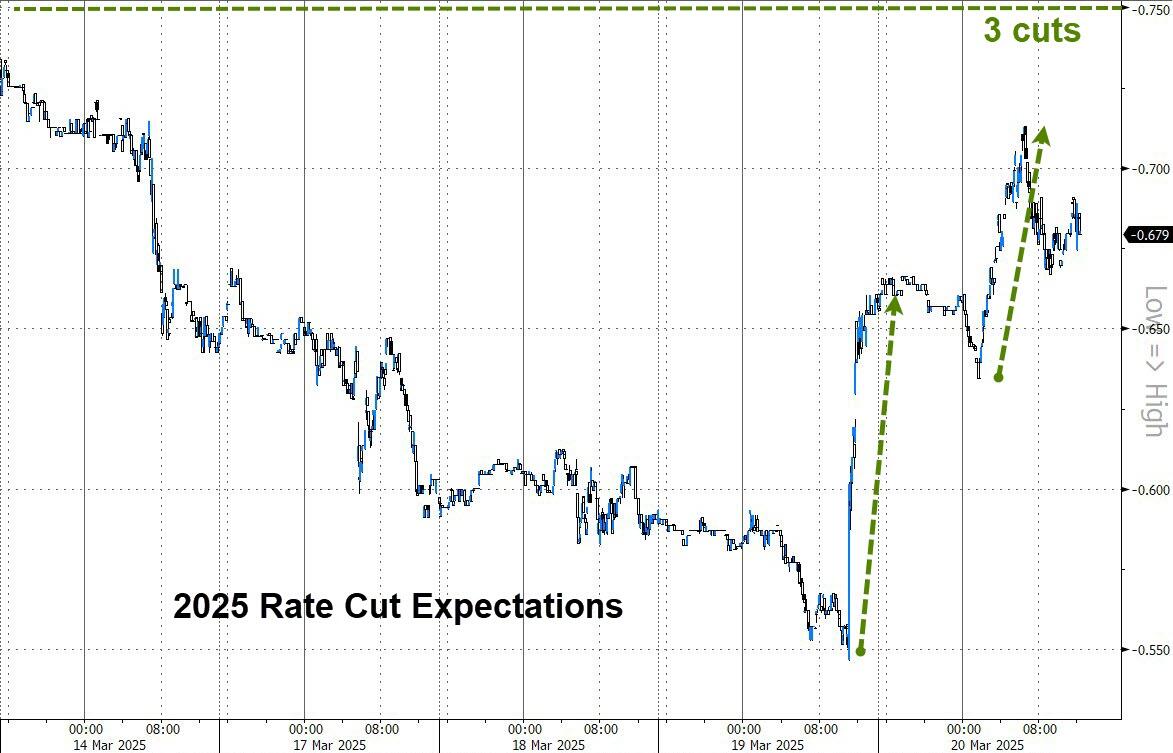
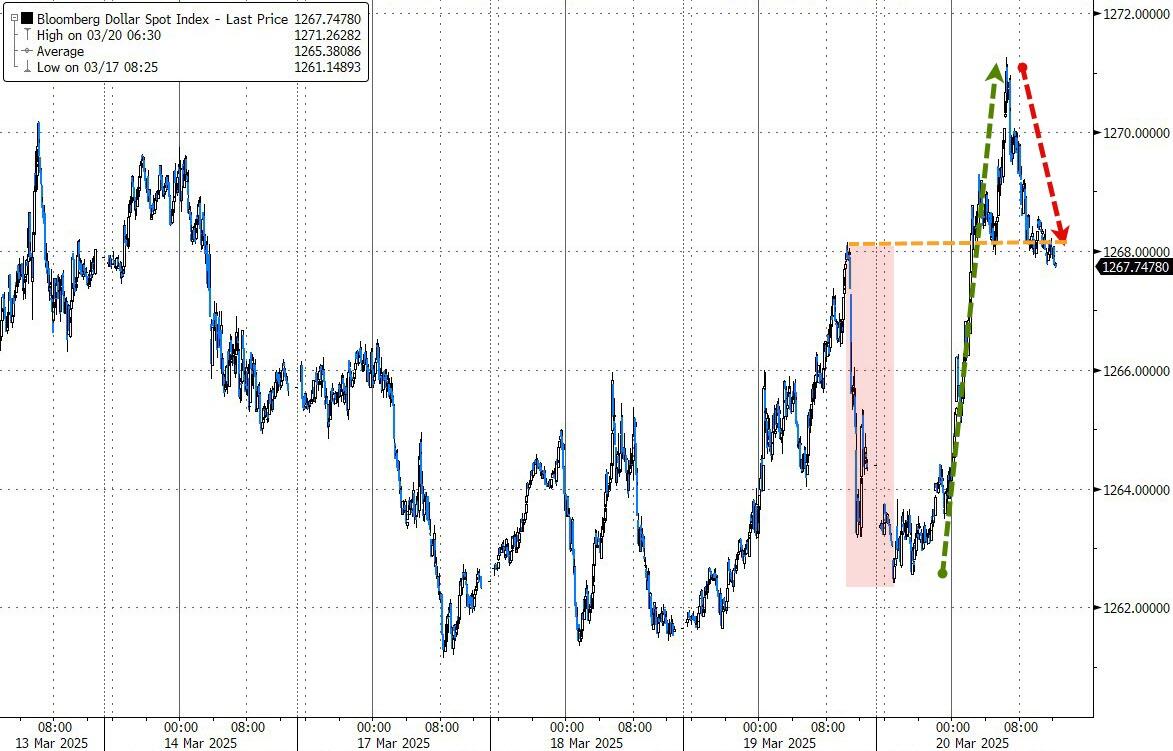
After an early bounce, the Mega-Cap tech sector reversed yesterday’s gains, mirroring the pattern of the most shorted stocks. Bond yields were mixed, rate cut expectations rose, and the dollar advanced.
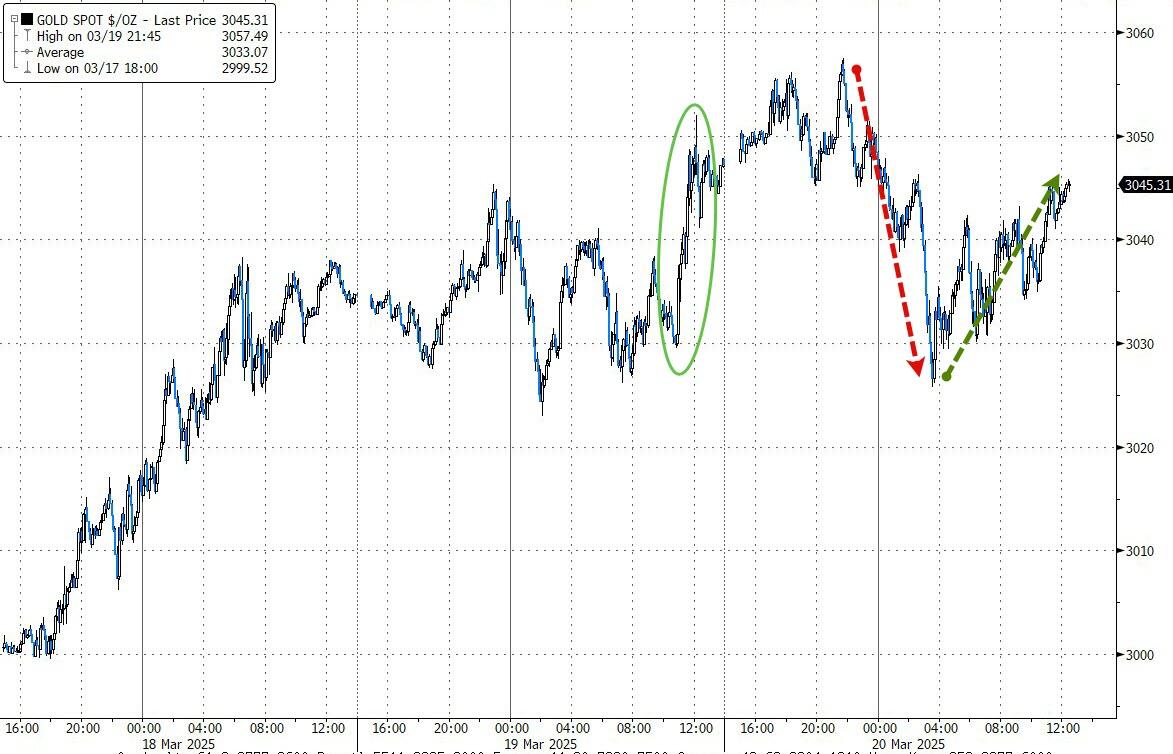
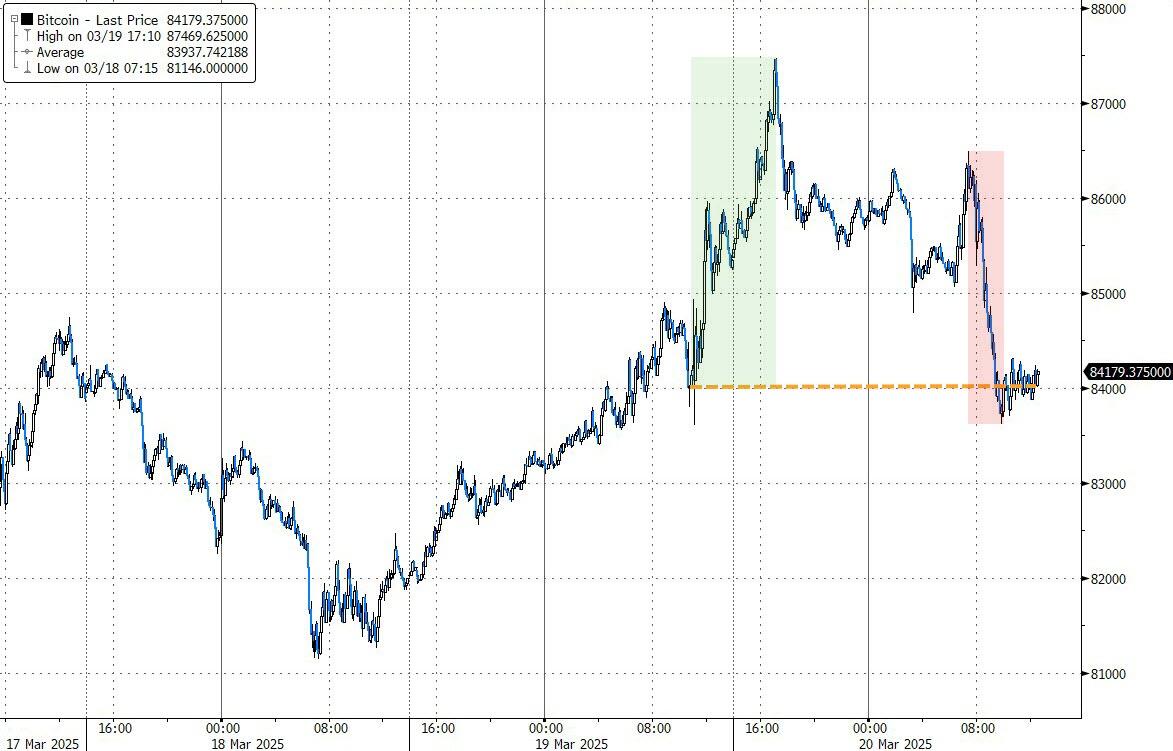
Despite the dollar’s gains, gold closed higher, reaching the $3,050 level. Bitcoin surged early on but gave back its gains late in the session.
Today’s trading was largely uneventful, but the positive takeaway is that we are nearing the end of the seasonally weakest period of the year.
Will April align with its historically bullish trend?
2. Current “Buy” Cycles (effective 11/21/2023)
Our Trend Tracking Indexes (TTIs) have both crossed their trend lines with enough strength to trigger new “Buy” signals. That means, Tuesday, 11/21/2023, was the official date for these signals.
If you want to follow our strategy, you should first decide how much you want to invest based on your risk tolerance (percentage of allocation). Then, you should check my Thursday StatSheet and Saturday’s “ETFs on the Cutline” report for suitable ETFs to buy.
3. Trend Tracking Indexes (TTIs)
The major indexes started the day positively but couldn’t maintain their gains. Bearish momentum emerged, leading to a moderately negative close for equities.
Similarly, our TTIs also retreated.
This is how we closed 03/20/2025:
Domestic TTI: -0.53% below its M/A (prior close -0.14%)—Buy signal effective 11/21/2023.
International TTI: +5.63% above its M/A (prior close +6.22%)—Buy signal effective 11/21/2023.
All linked charts above are courtesy of Bloomberg via ZeroHedge.
———————————————————-
WOULD YOU LIKE TO HAVE YOUR INVESTMENTS PROFESSIONALLY MANAGED?
Do you have the time to follow our investment plans yourself? If you are a busy professional who would like to have his portfolio managed using our methodology, please contact me directly to get more details.
Contact Ulli