
- Moving the market
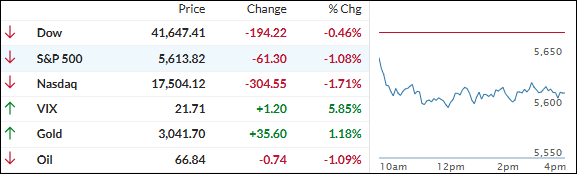
The two-day comeback rally hit a brick wall today, with the major indexes retreating, led by the Nasdaq.
Tesla was one of the hardest-hit stocks, falling over 5% after an analyst lowered its price target due to rising competition in the EV space. The company’s stock has declined about 36% over the past month.
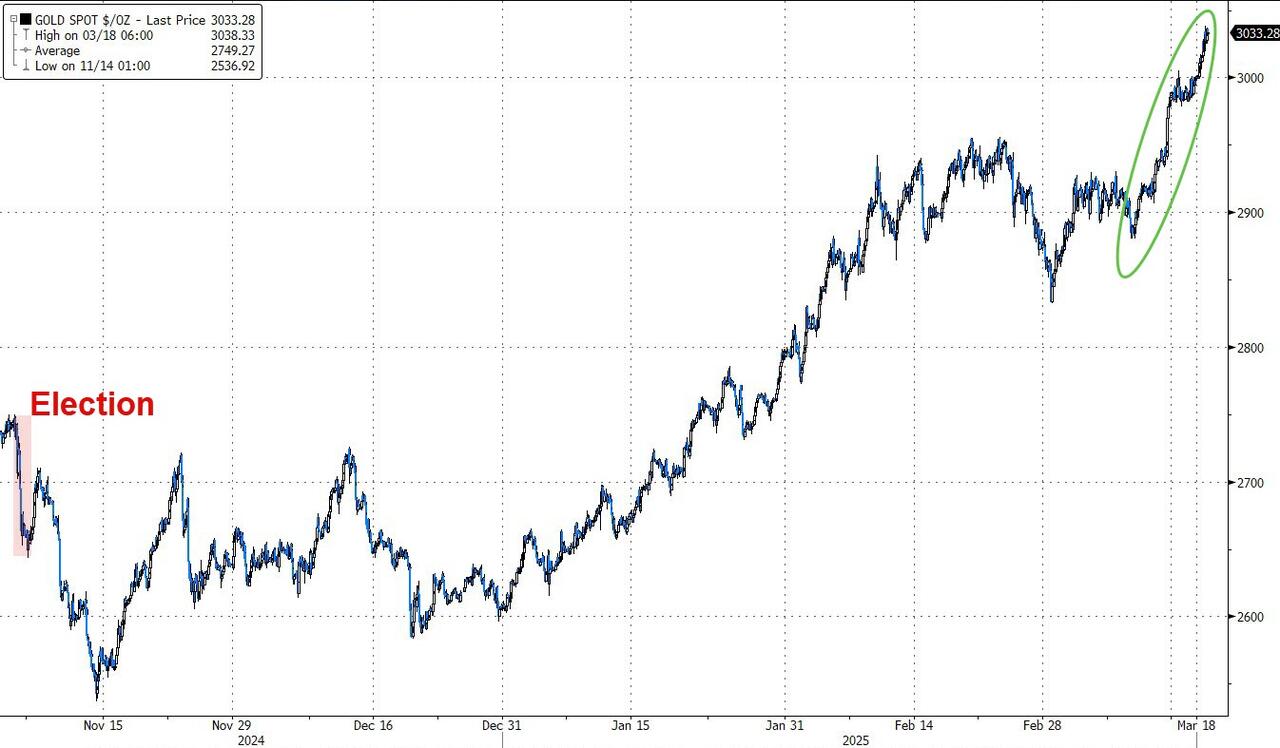
The S&P 500 officially entered correction territory last week, dropping 10% from its recent high. It now sits on the cusp of either breaking out to the upside or breaking down further. The three major indexes are down year-to-date and have been outperformed by gold, which has gained almost 15% over the same period.
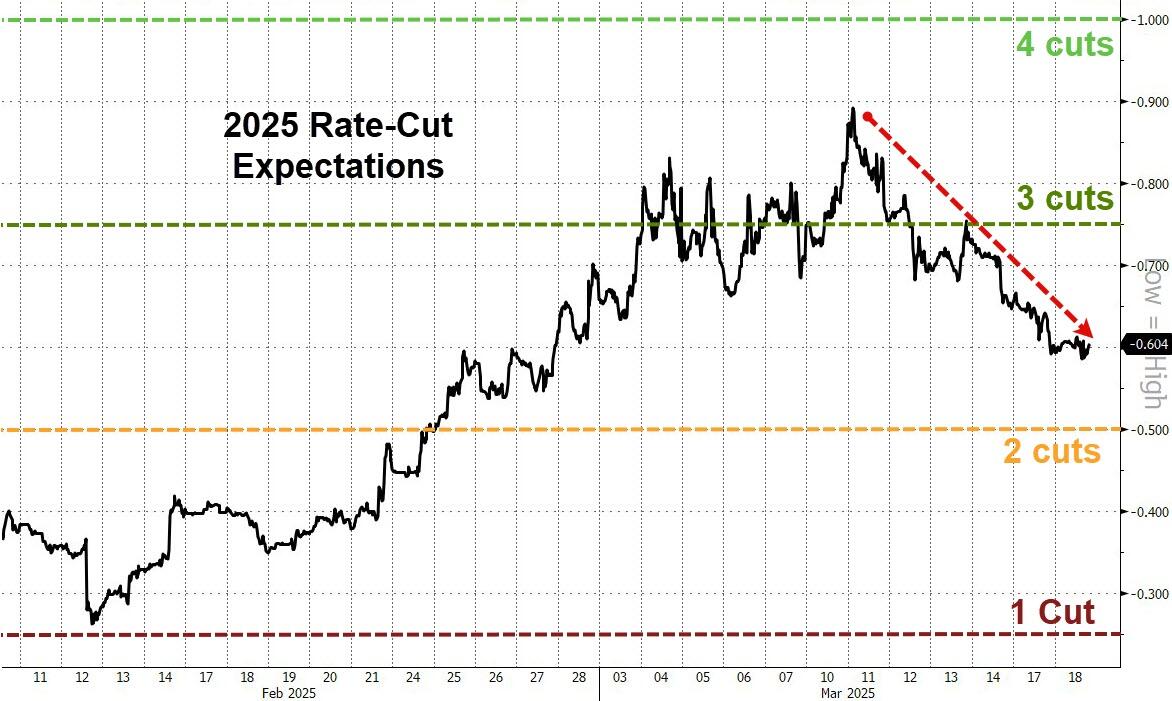
Traders are anxiously observing the Fed’s two-day policy meeting, which concludes tomorrow afternoon with a press conference. Current odds are 99% that the central bank will hold rates steady, despite wishful thinking on Wall Street that the recent “growth scare” might sway the Fed to lower rates.
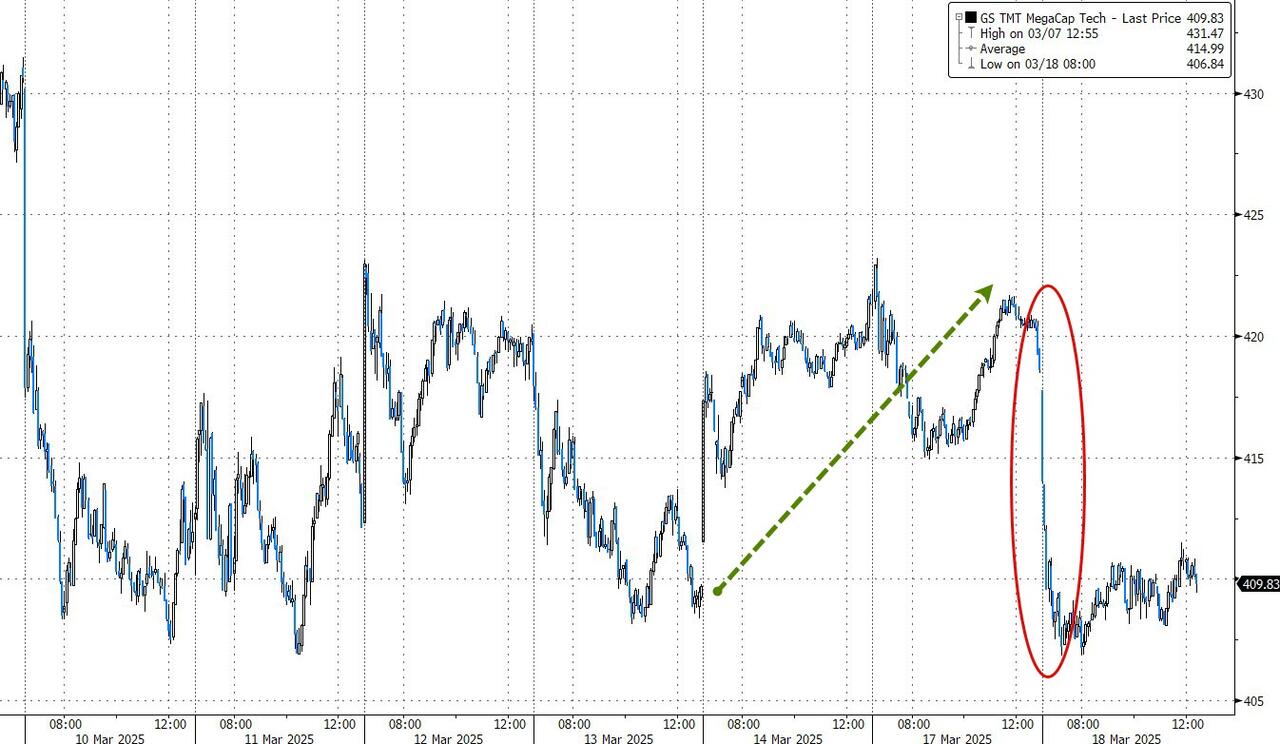
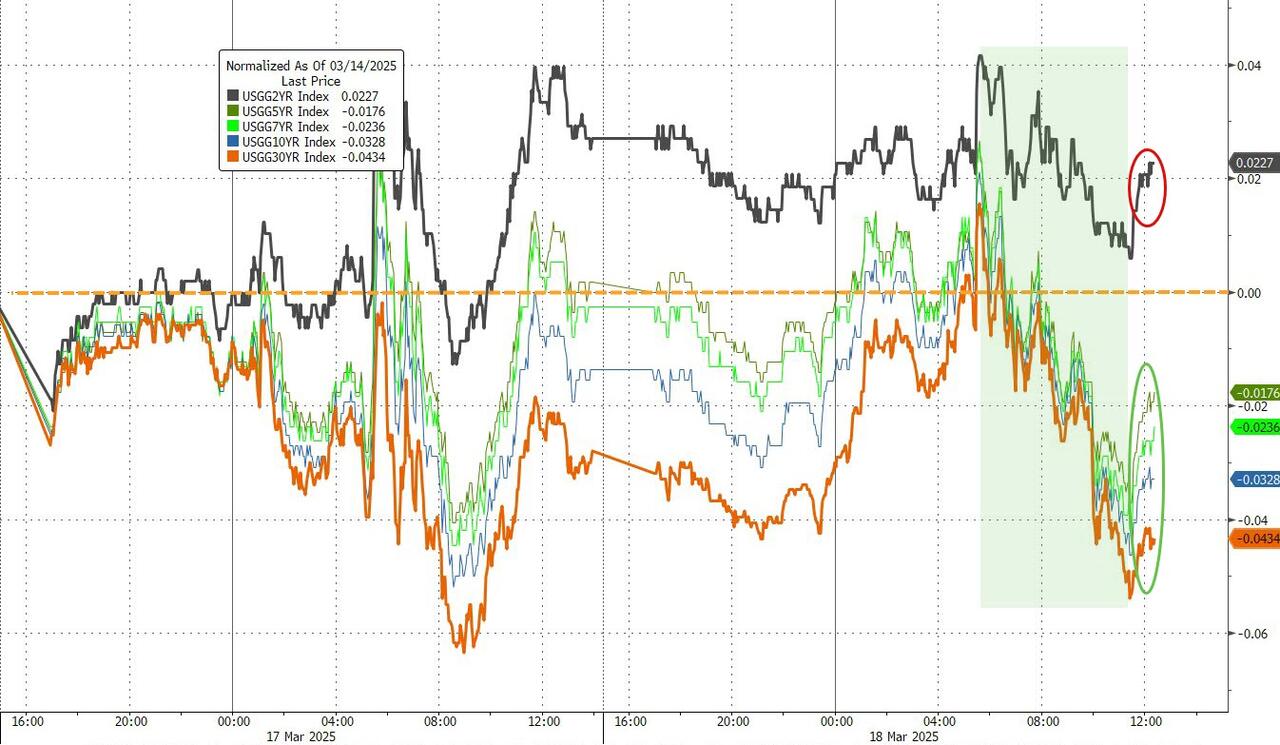
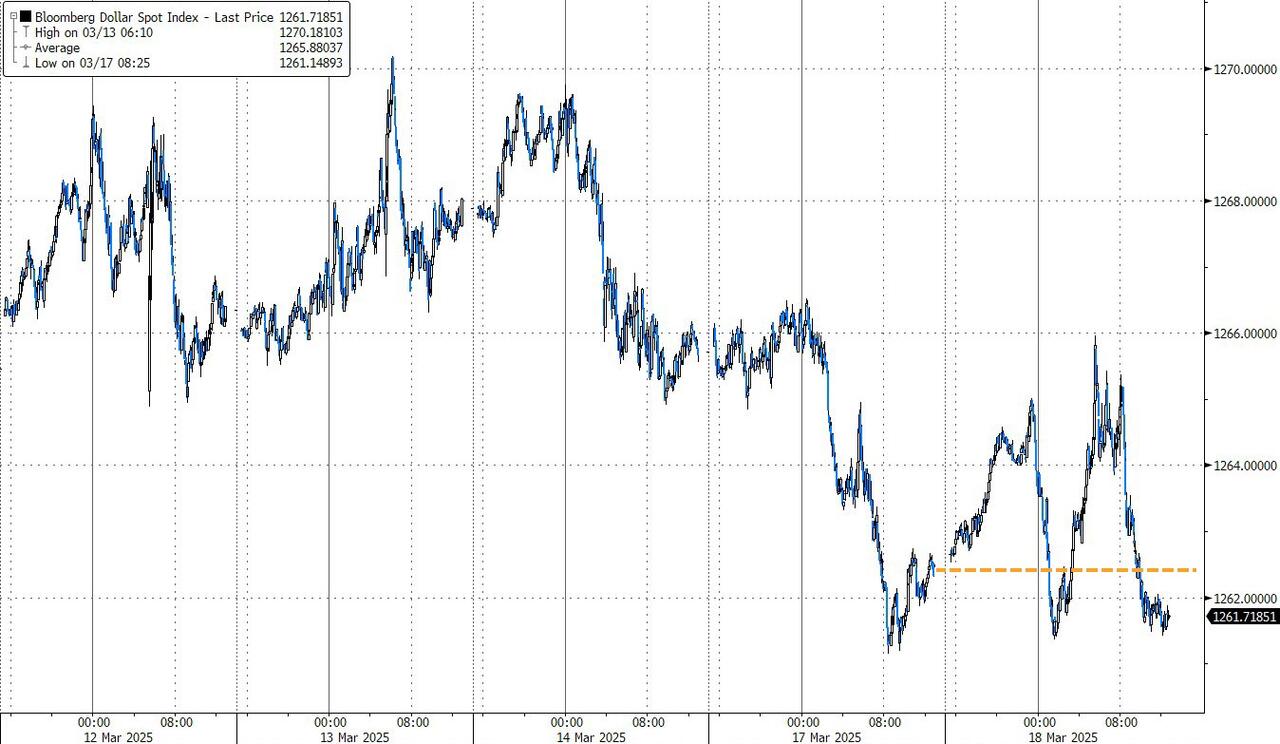
Offsetting that scare somewhat were positive housing starts and record-high industrial production, though rising import prices have dampened expectations for a rate cut. Big tech stocks took a dive today, bond yields were mixed, and the dollar swung wildly before ending only modestly lower.
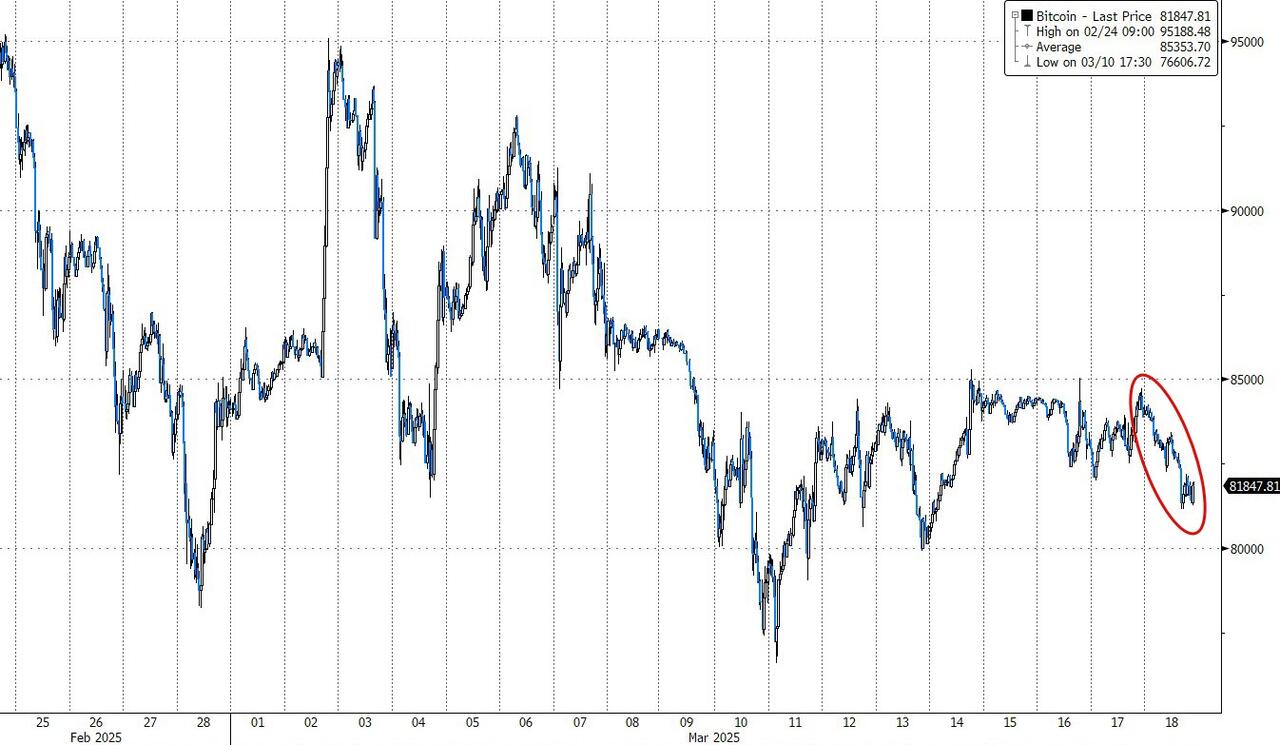
Gold continued its strong performance, advancing deeper into the $3,000 territory, while Bitcoin lost its footing and fell back to the $81,000 level.
All eyes are now on the Fed’s announcement on interest rates tomorrow, but traders will be closely analyzing Fed Chair Powell’s commentary to determine if we are facing a “risk on” or “risk off” scenario moving forward.
2. Current “Buy” Cycles (effective 11/21/2023)
Our Trend Tracking Indexes (TTIs) have both crossed their trend lines with enough strength to trigger new “Buy” signals. That means, Tuesday, 11/21/2023, was the official date for these signals.
If you want to follow our strategy, you should first decide how much you want to invest based on your risk tolerance (percentage of allocation). Then, you should check my Thursday StatSheet and Saturday’s “ETFs on the Cutline” report for suitable ETFs to buy.
3. Trend Tracking Indexes (TTIs)
Equities opened lower and remained in negative territory throughout the session, unable to find a catalyst to reverse the early losses. With the Federal Reserve’s interest rate decision expected tomorrow, bullish investors opted to stay on the sidelines.
Our TTIs ended the session mixed. The international TTI edged higher, while the domestic TTI lost some of its recent gains and stayed just below its long-term trend line.
As a result, we need more directional clarity before making any changes to our strategy.
This is how we closed 03/18/2025:
Domestic TTI: -0.85% below its M/A (prior close -0.33%)—Buy signal effective 11/21/2023.
International TTI: +5.77% above its M/A (prior close +5.55%)—Buy signal effective 11/21/2023.
All linked charts above are courtesy of Bloomberg via ZeroHedge.
———————————————————-
WOULD YOU LIKE TO HAVE YOUR INVESTMENTS PROFESSIONALLY MANAGED?
Do you have the time to follow our investment plans yourself? If you are a busy professional who would like to have his portfolio managed using our methodology, please contact me directly to get more details.
Contact Ulli