
- Moving the market
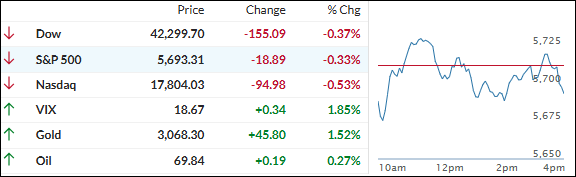
The markets opened in the red, but early positive sentiment helped the major indexes recover and cross into positive territory.
However, this rebound was short-lived, and the indexes ultimately reversed to end with moderate losses.
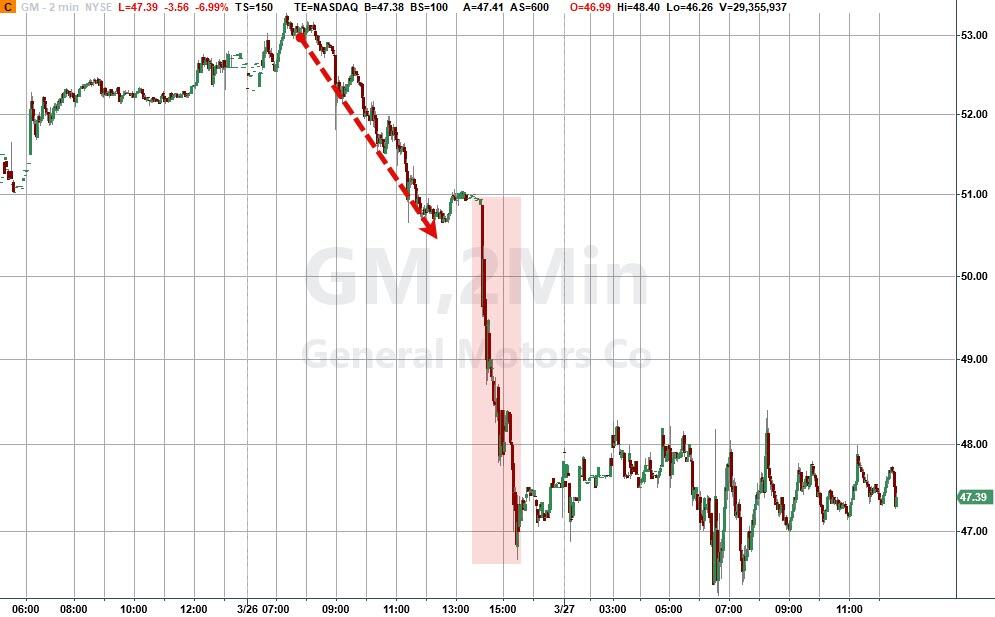
Traders were focused on Trump’s latest 25% tariff on foreign automakers, which led to declines in U.S. carmakers: GM fell over 7%, Stellantis dropped 1%, and Ford dipped nearly 4%.
Offsetting this news were hints from Trump that the April 2nd levies would be “very lenient” and that he might reduce tariffs on China to facilitate a deal with ByteDance’s TikTok.
Conversely, he threatened to impose “far larger” tariffs on the European Union and Canada if they collaborate to combat trade tariffs.
These developments did little to calm the markets, suggesting that any rebound in stocks may be short-lived, as seen in recent times. Volatility is likely to persist until policy uncertainty is resolved.
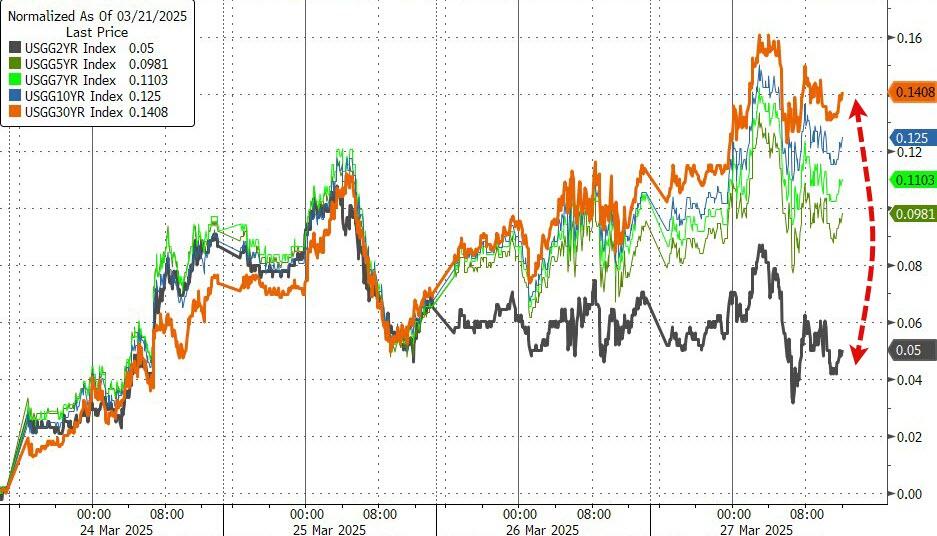
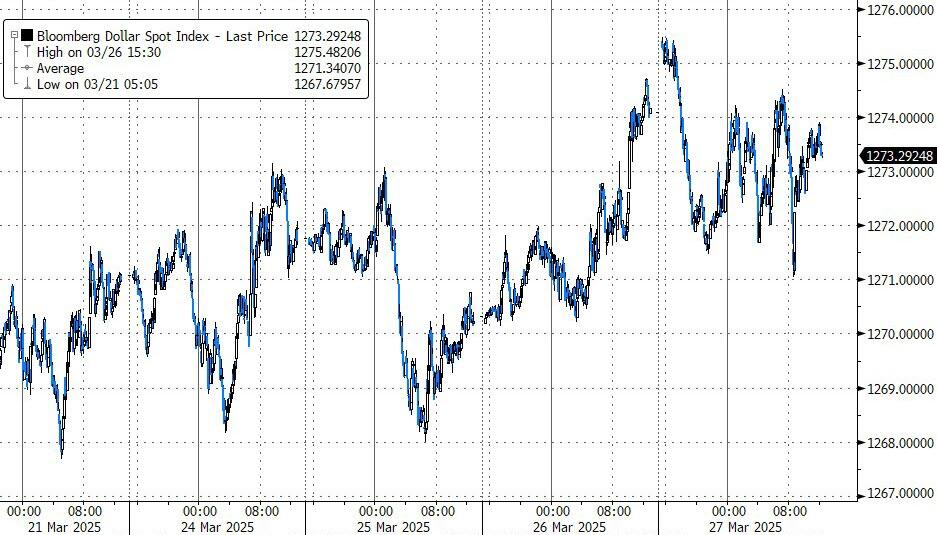
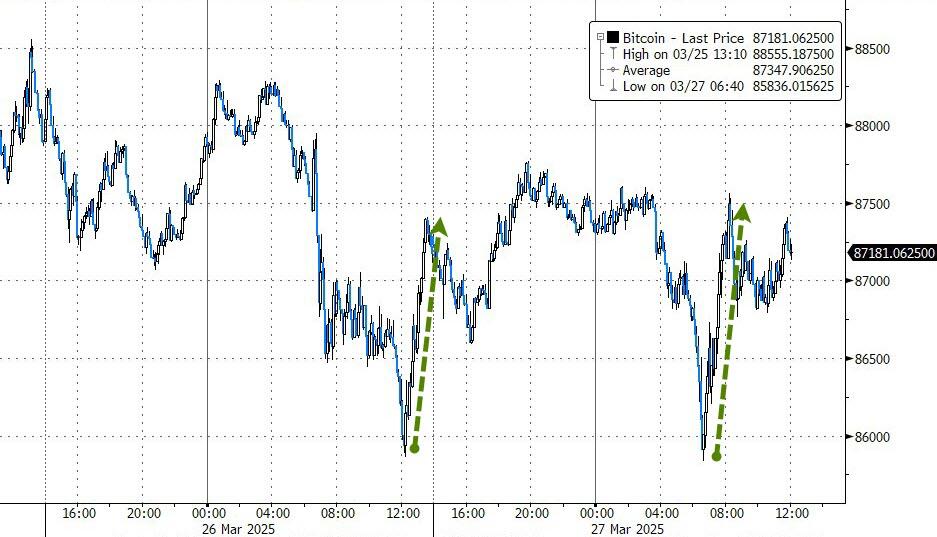
Bond yields were mixed, the dollar dipped, and Bitcoin saw volatility but found support at $86k.
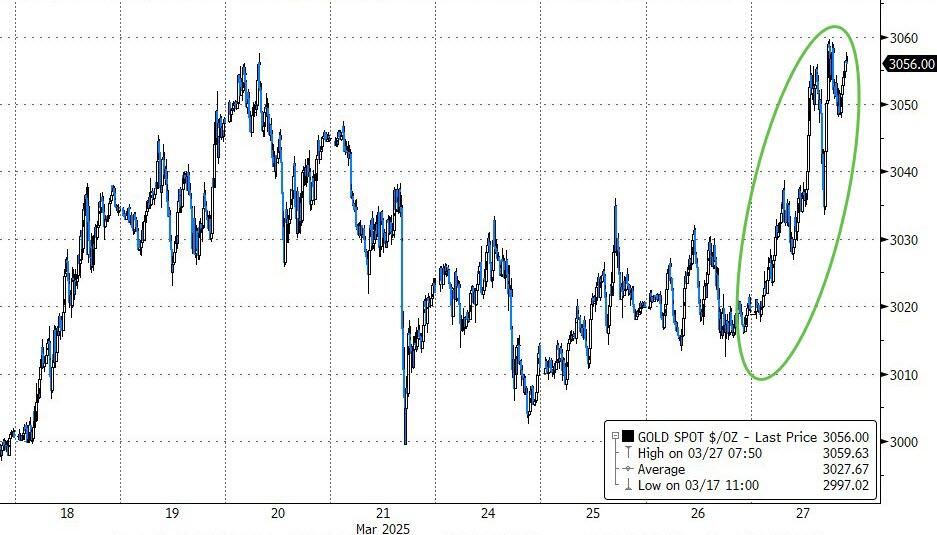
Gold was the standout performer, hitting a new record high just shy of $3,060, boosting its quarterly advance to over 16%—its highest quarterly gain since 1986, as noted by ZH.
Will we see gold break $3,100 in April?
2. Current “Buy” Cycles (effective 11/21/2023)
Our Trend Tracking Indexes (TTIs) have both crossed their trend lines with enough strength to trigger new “Buy” signals. That means, Tuesday, 11/21/2023, was the official date for these signals.
If you want to follow our strategy, you should first decide how much you want to invest based on your risk tolerance (percentage of allocation). Then, you should check my Thursday StatSheet and Saturday’s “ETFs on the Cutline” report for suitable ETFs to buy.
3. Trend Tracking Indexes (TTIs)
The major indexes initially opened in the red but were soon lifted into the green by positive early sentiment. However, as the session progressed, the mood shifted, and equities lost momentum, resulting in their second consecutive daily loss.
Our TTIs were also affected and retreated.
This is how we closed 03/27/2025:
Domestic TTI: -0.76% below its M/A (prior close -0.51%)—Buy signal effective 11/21/2023.
International TTI: +5.04% above its M/A (prior close +5.30%)—Buy signal effective 11/21/2023.
All linked charts above are courtesy of Bloomberg via ZeroHedge.
———————————————————-
WOULD YOU LIKE TO HAVE YOUR INVESTMENTS PROFESSIONALLY MANAGED?
Do you have the time to follow our investment plans yourself? If you are a busy professional who would like to have his portfolio managed using our methodology, please contact me directly to get more details.
Contact Ulli