
- Moving the market
The major indexes attempted an early relief rally, but conflicting economic data and uncertainty over Trump’s tariffs and their duration kept them fluctuating around their respective unchanged lines.
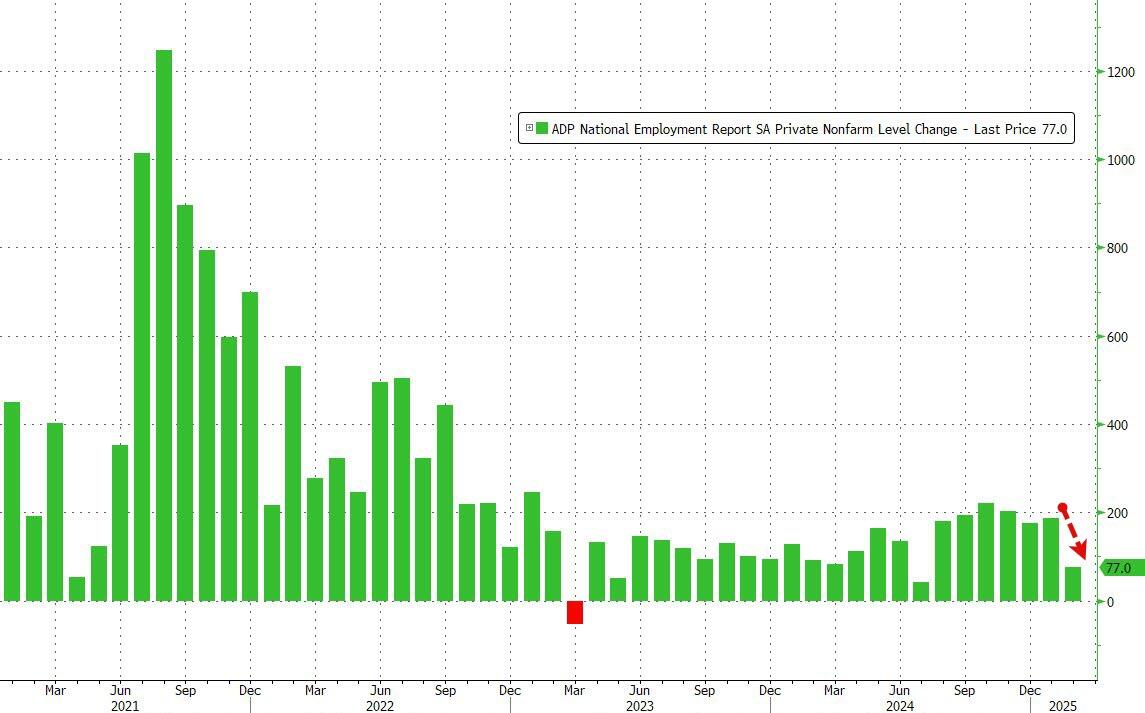
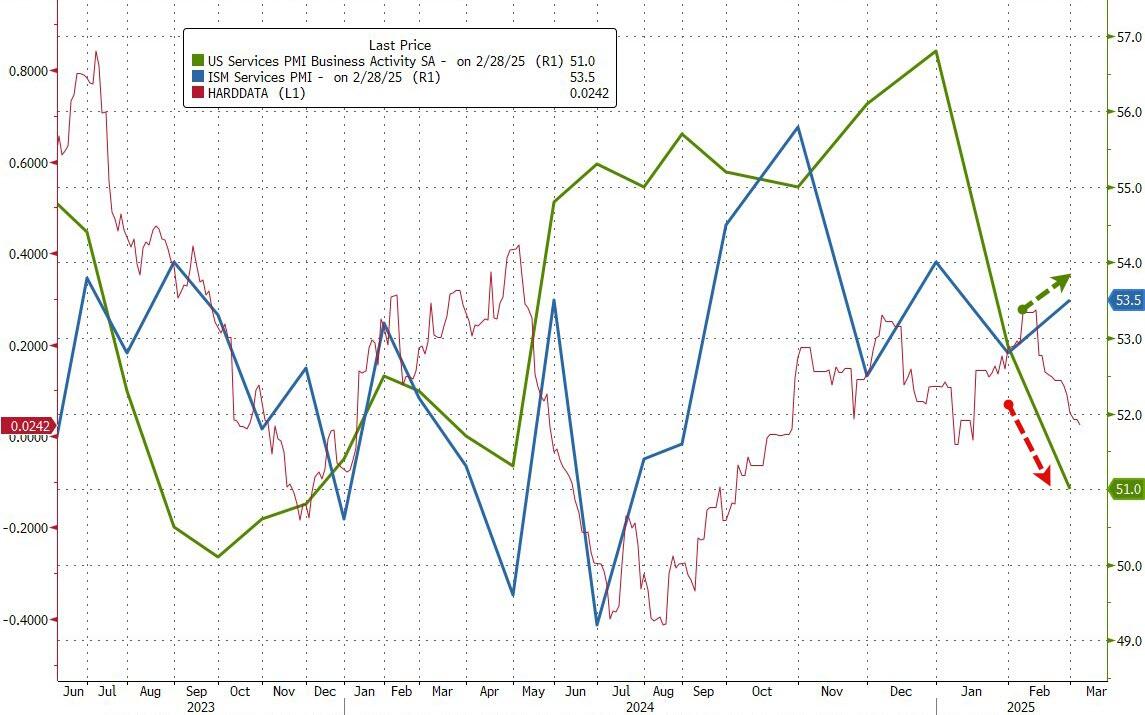
ADV’s private payroll report showed less job growth than anticipated, while service sector data slightly exceeded expectations. This reinforced the view that the economy is cooling.
After a lackluster opening, the markets received a boost from a midday announcement by the Trump team, granting a one-month tariff exemption to automakers in Canada and Mexico. This reignited bullish sentiment, pushing the indexes to a solidly green close.
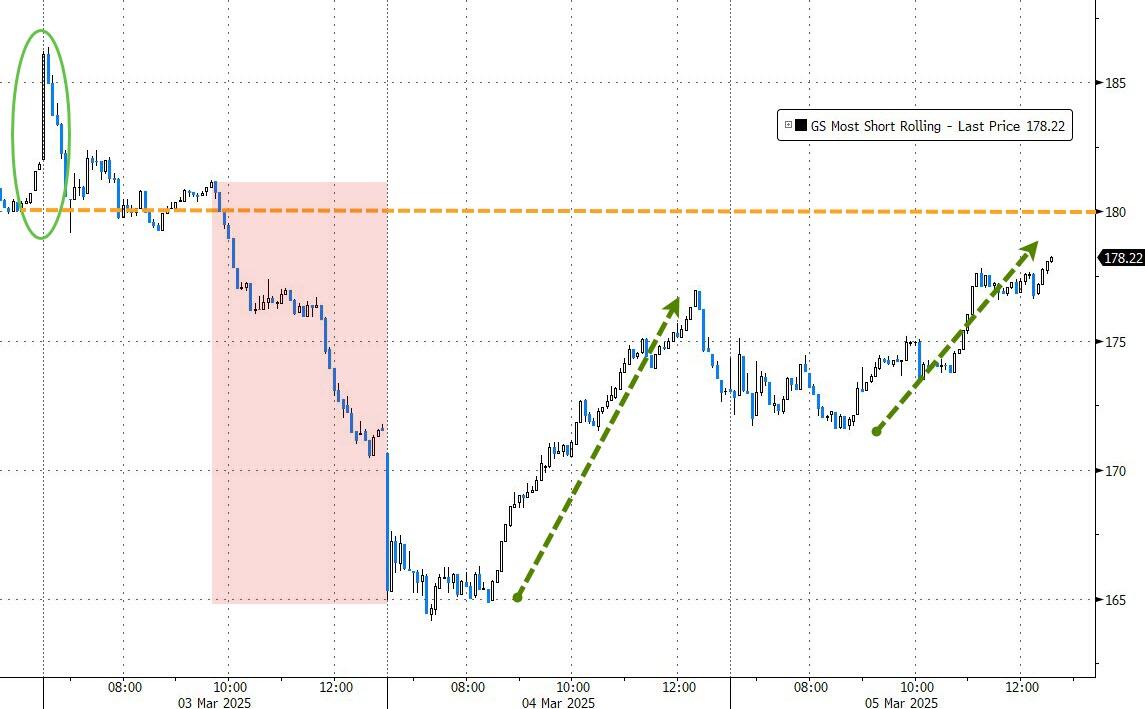
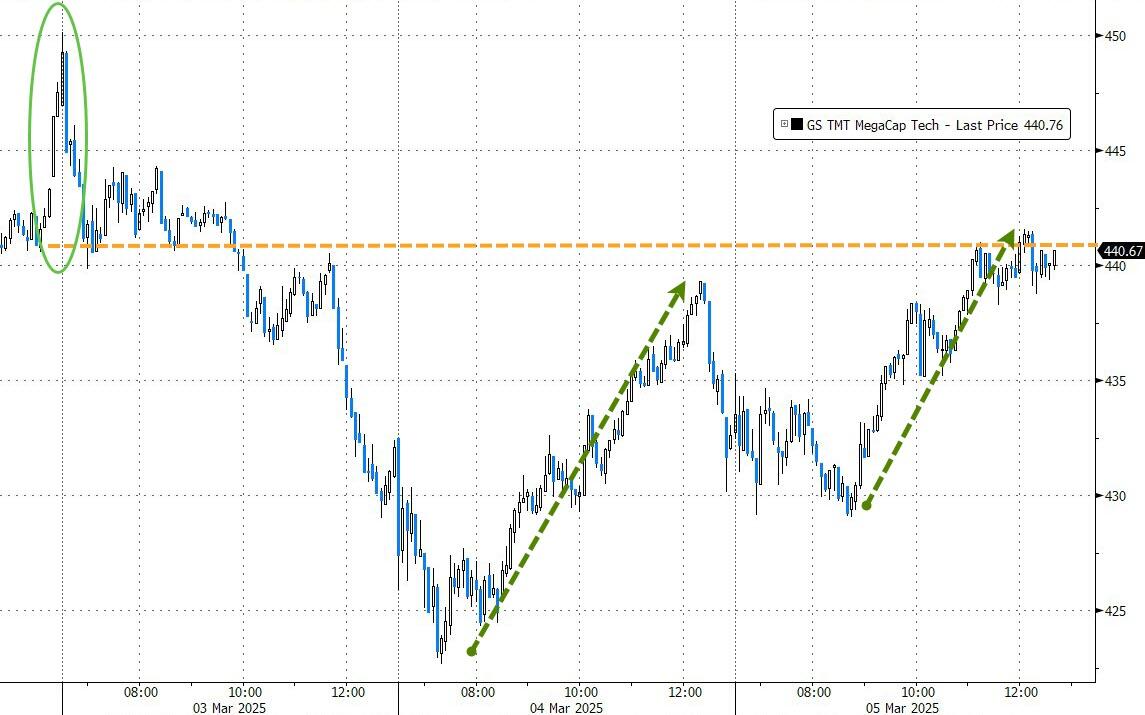
The most shorted stocks were squeezed for the second consecutive day, with mega-cap tech continuing yesterday’s uptrend despite a few dips. The S&P 500 and Nasdaq firmly bounced off their respective 200-day moving averages.
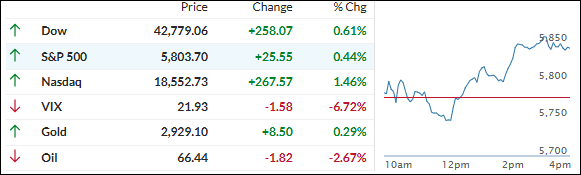
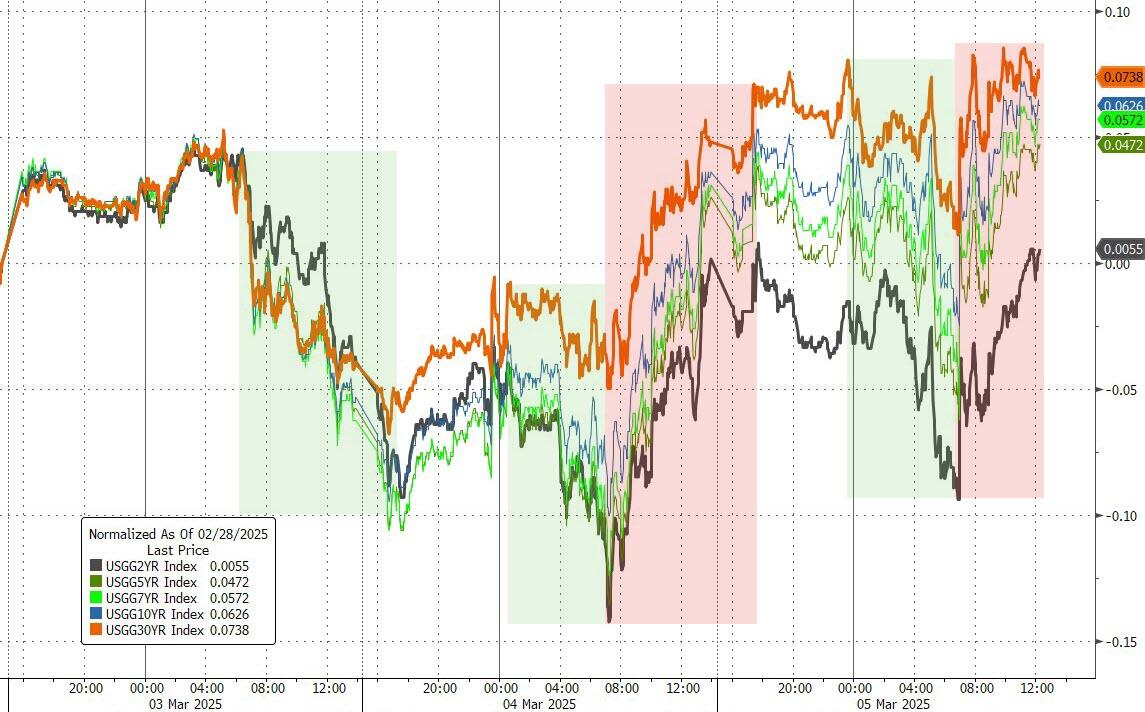
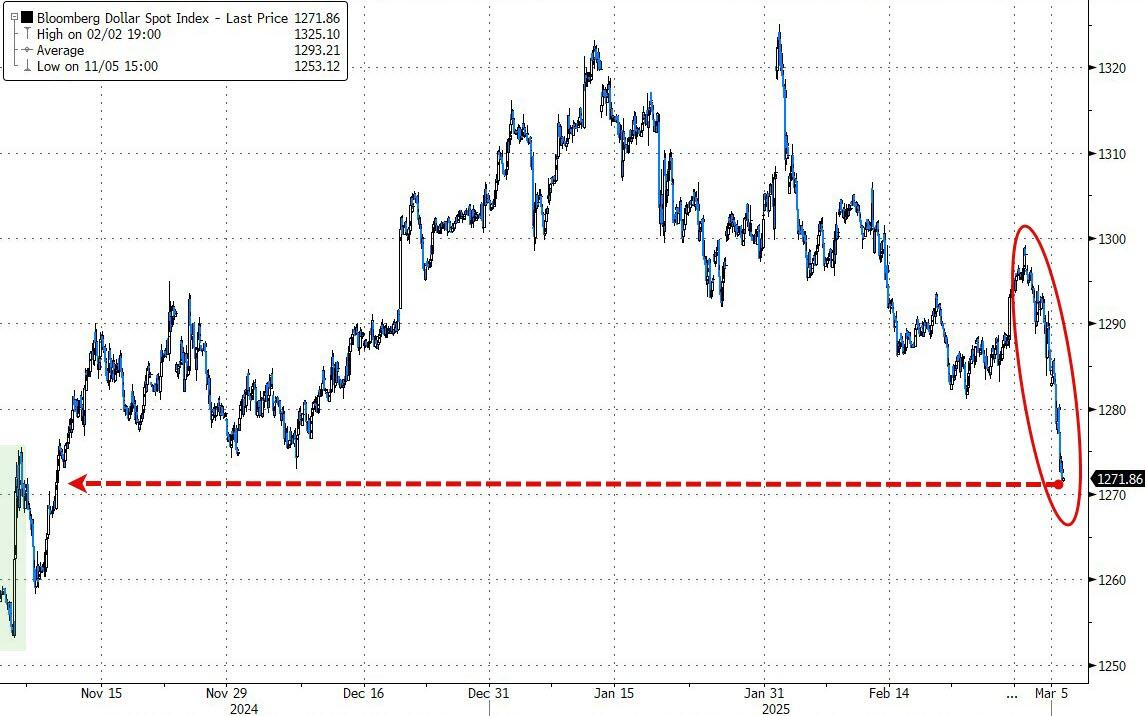
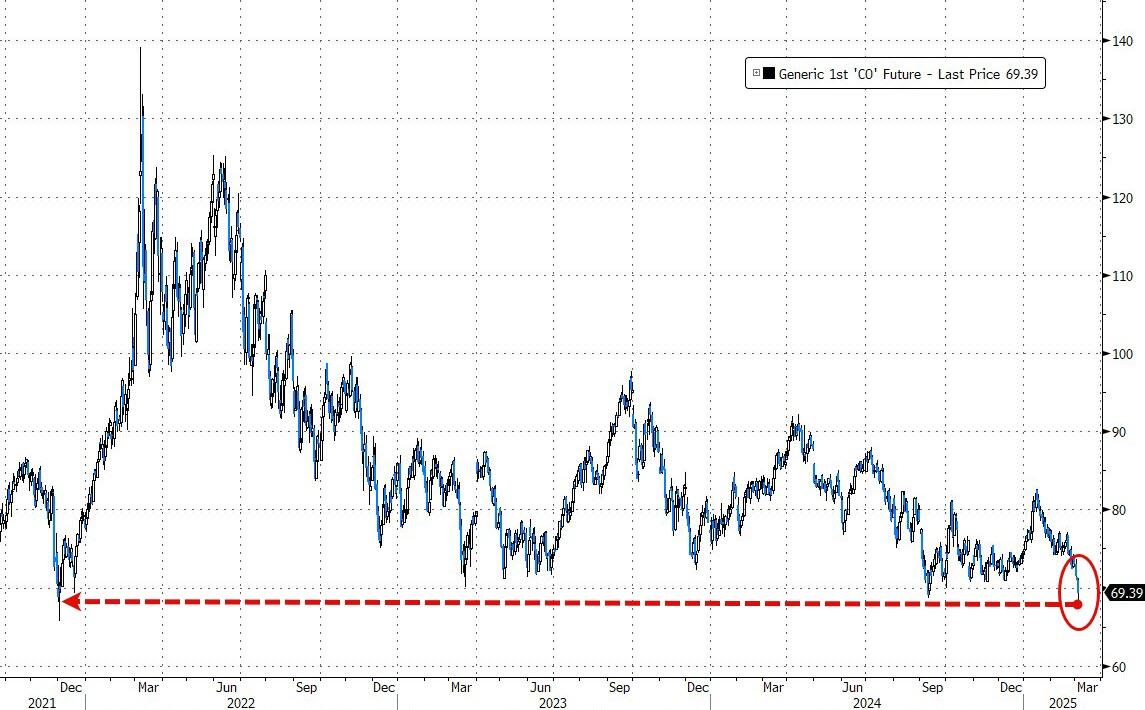
Bond yields faced volatility, with the 10-year yield slightly rising. The dollar and crude oil both declined, while gold surged to close above $2,920.
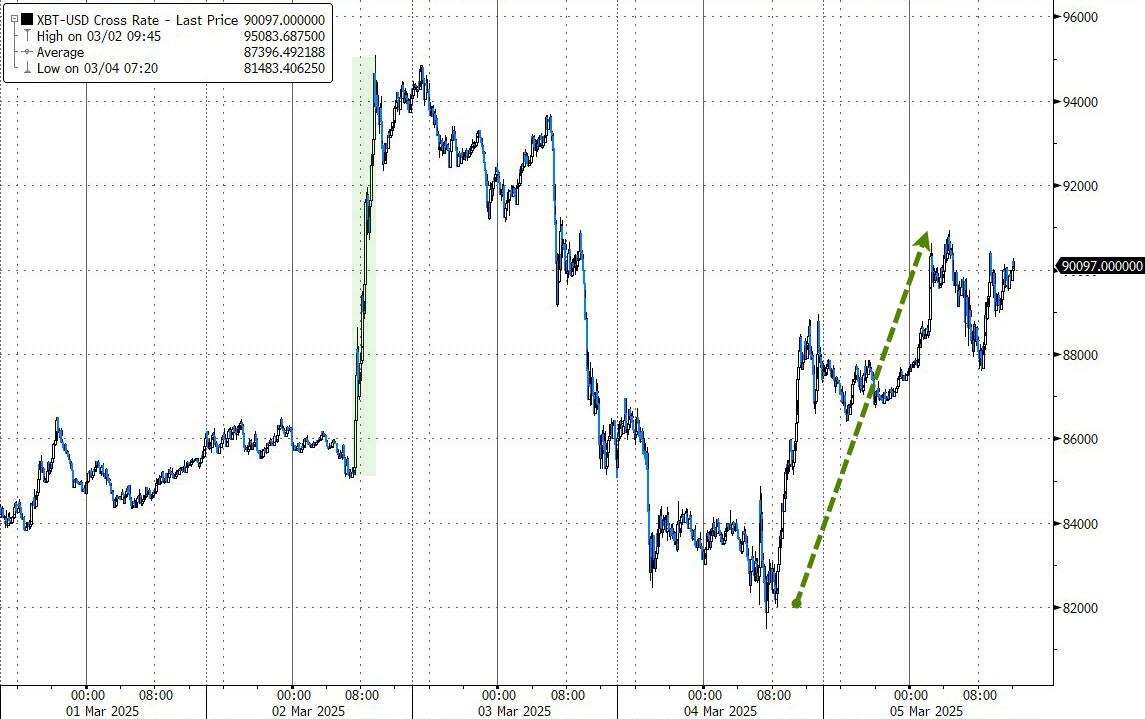
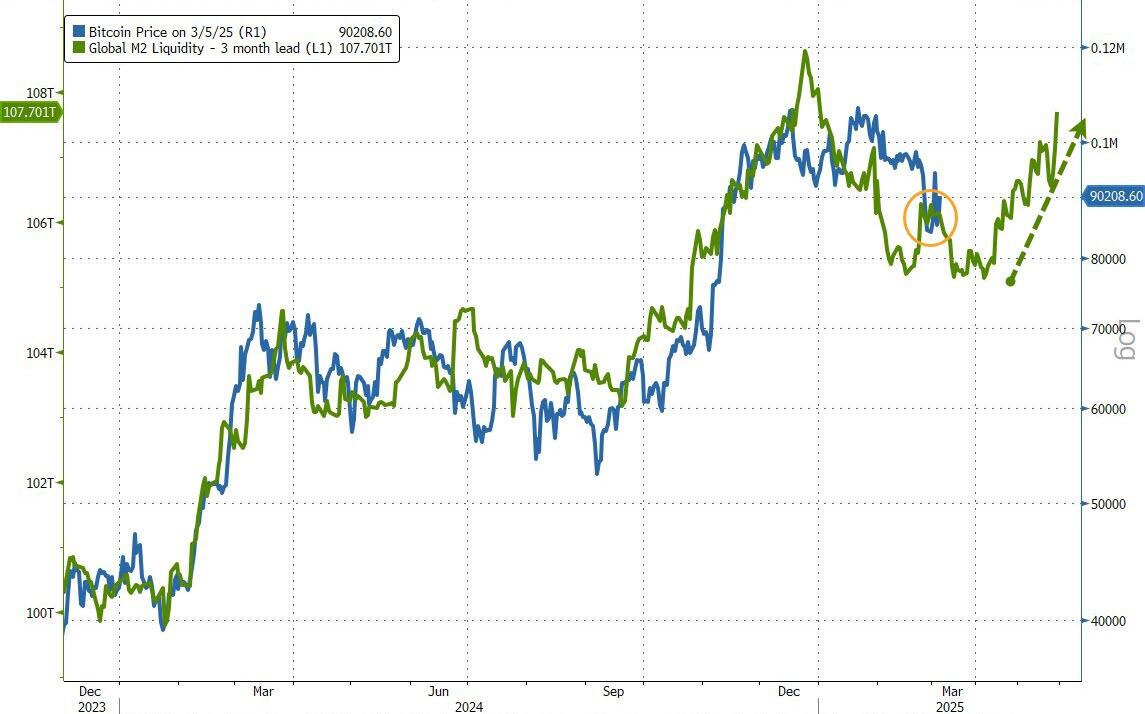
Bitcoin built on yesterday’s rebound to reach the $90k level again. According to ZH, if the trend of global liquidity holds true, Bitcoin may have one more dip to the $80k area before recovering and charging into record territory.
2. Current “Buy” Cycles (effective 11/21/2023)
Our Trend Tracking Indexes (TTIs) have both crossed their trend lines with enough strength to trigger new “Buy” signals. That means, Tuesday, 11/21/2023, was the official date for these signals.
If you want to follow our strategy, you should first decide how much you want to invest based on your risk tolerance (percentage of allocation). Then, you should check my Thursday StatSheet and Saturday’s “ETFs on the Cutline” report for suitable ETFs to buy.
3. Trend Tracking Indexes (TTIs)
Unlike recent sessions, the major indexes held steady and capitalized on positive midday tariff news, rallying to a solid green close.
Our TTIs mirrored this trend, with both gaining and creating a more comfortable gap between their closing prices and respective trend lines.
This is how we closed 03/05/2025:
Domestic TTI: +1.19% above its M/A (prior close +0.26%)—Buy signal effective 11/21/2023.
International TTI: +6.48% above its M/A (prior close +4.67%)—Buy signal effective 11/21/2023.
All linked charts above are courtesy of Bloomberg via ZeroHedge.
———————————————————-
WOULD YOU LIKE TO HAVE YOUR INVESTMENTS PROFESSIONALLY MANAGED?
Do you have the time to follow our investment plans yourself? If you are a busy professional who would like to have his portfolio managed using our methodology, please contact me directly to get more details.
Contact Ulli