
- Moving the market
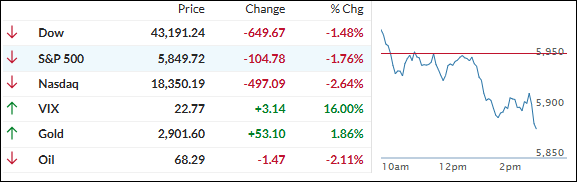
Equities started the first trading day of March with aimless meandering, leading to a rocky start.
Soft economic data from the construction and manufacturing sectors released today raised concerns about the state of the economy, causing major indexes to head sharply south and nearly wipe out Friday’s gains.
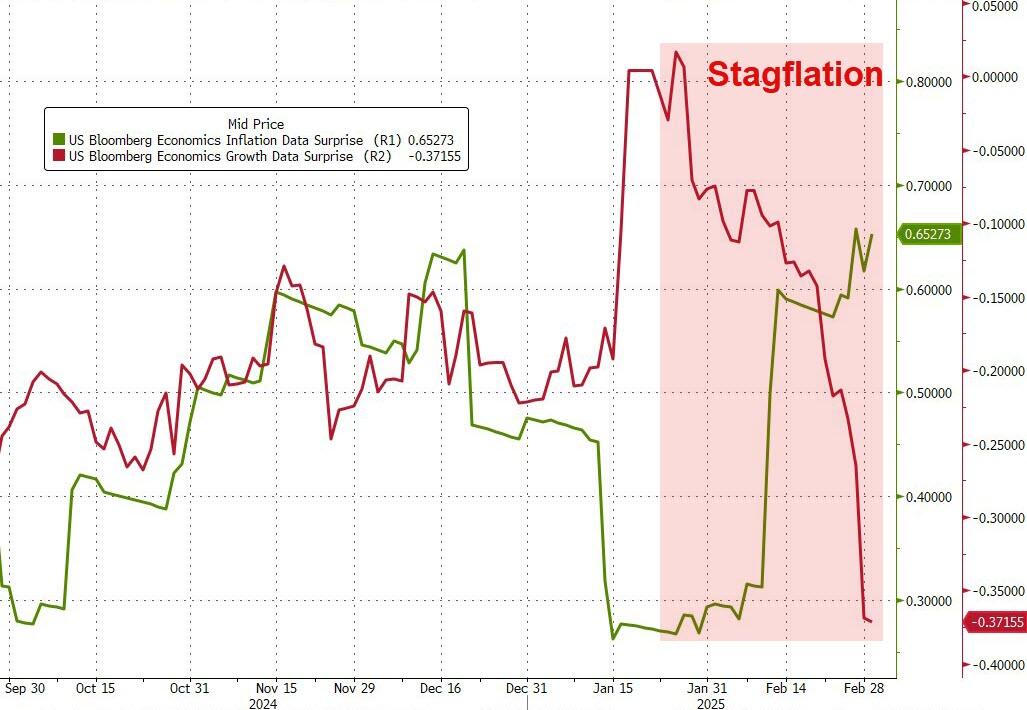
This reinforces the point that we have reached a stagflation scenario—low or no growth with rising inflation.
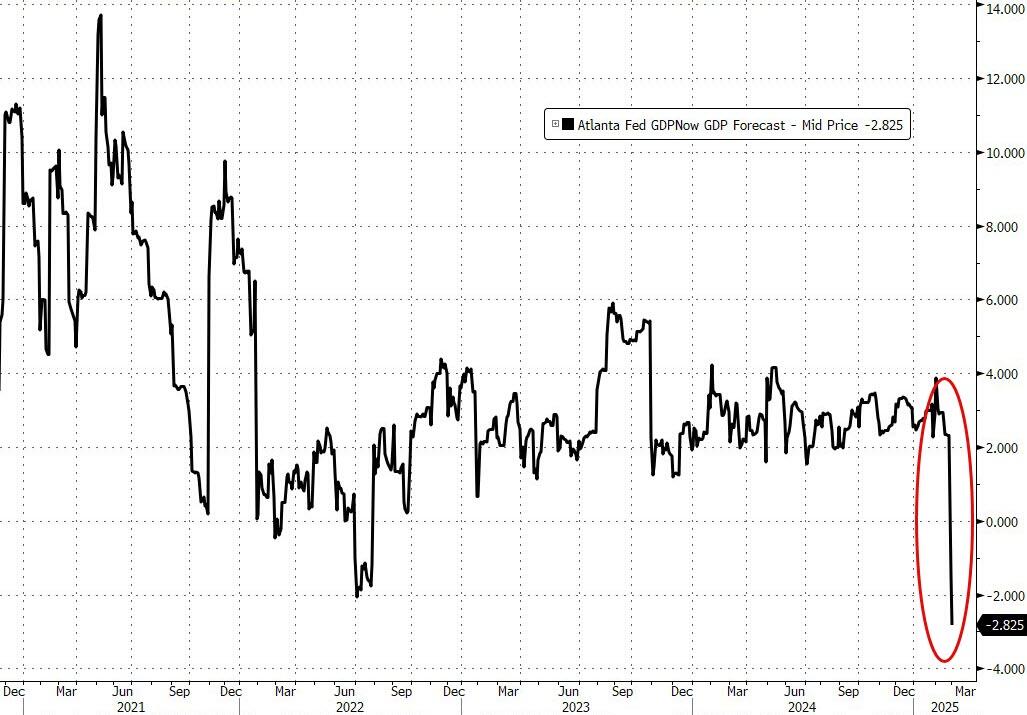
This week is crucial, with various data releases culminating in the February jobs report on Friday. Today, the Atlanta Fed slashed its GDPNOW forecast for Q1 to the worst level since the COVID lockdowns, confirming the current economic weakness.
Trump’s plans to impose import duties on Canada and Mexico are looming large this week, rattling traders and creating market volatility, as worries about more inflation remain in the foreground.
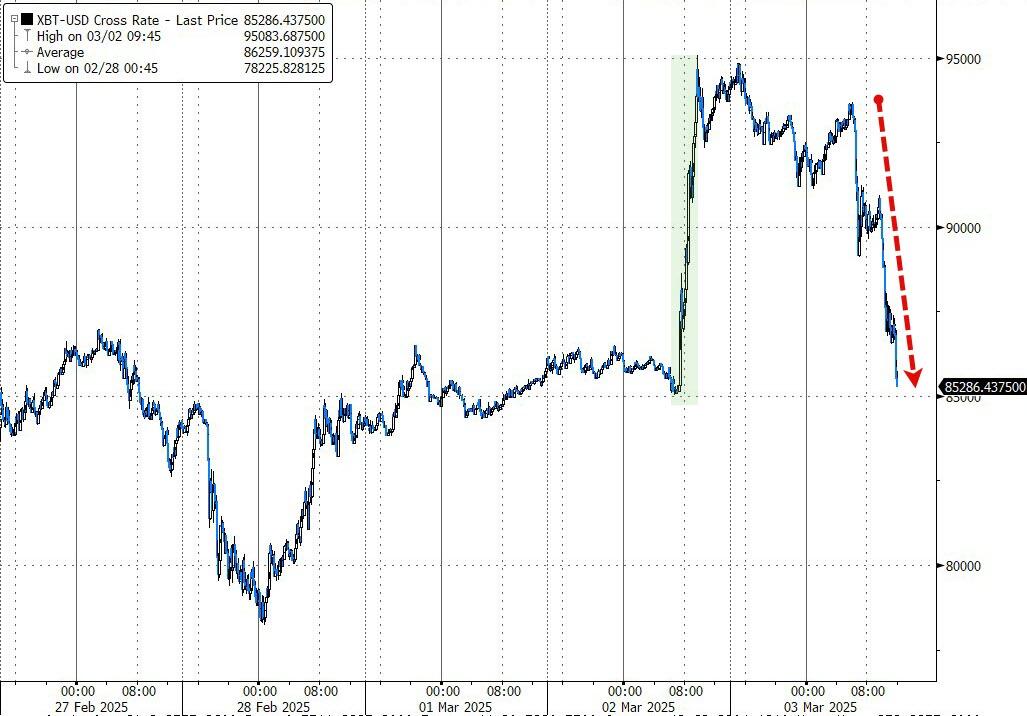
Over the weekend, Trump’s announcement of a strategic crypto reserve for the U.S., which will include a variety of coins, helped cryptocurrencies. Bitcoin jumped 10% to nearly $95k after dropping below $80k last Friday. However, today’s pullback towards the $85k area negated much of the positive effect.
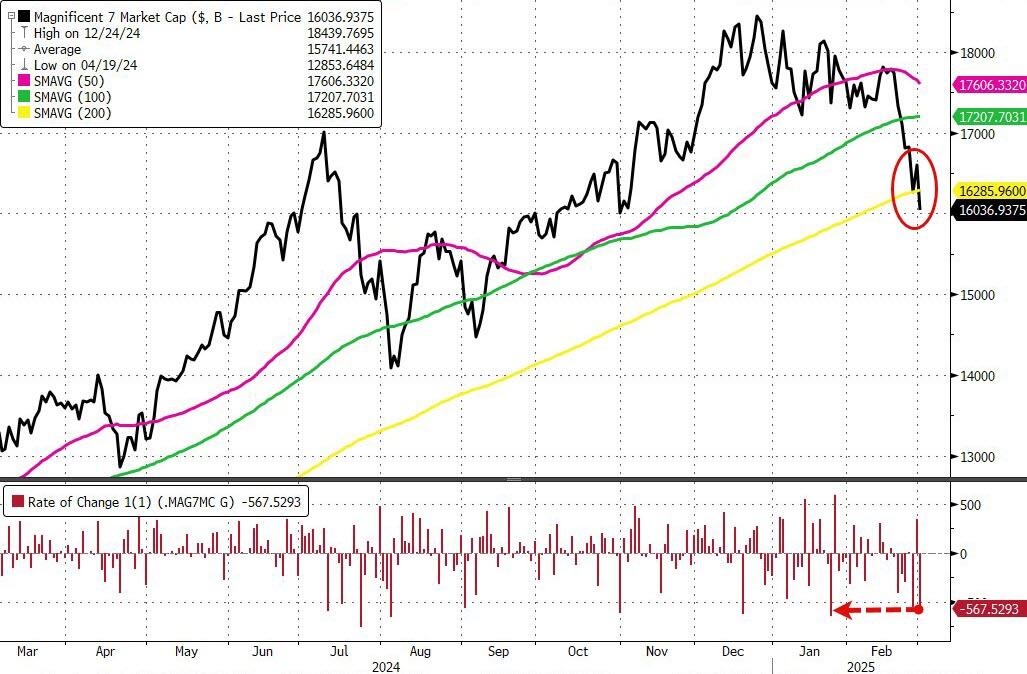
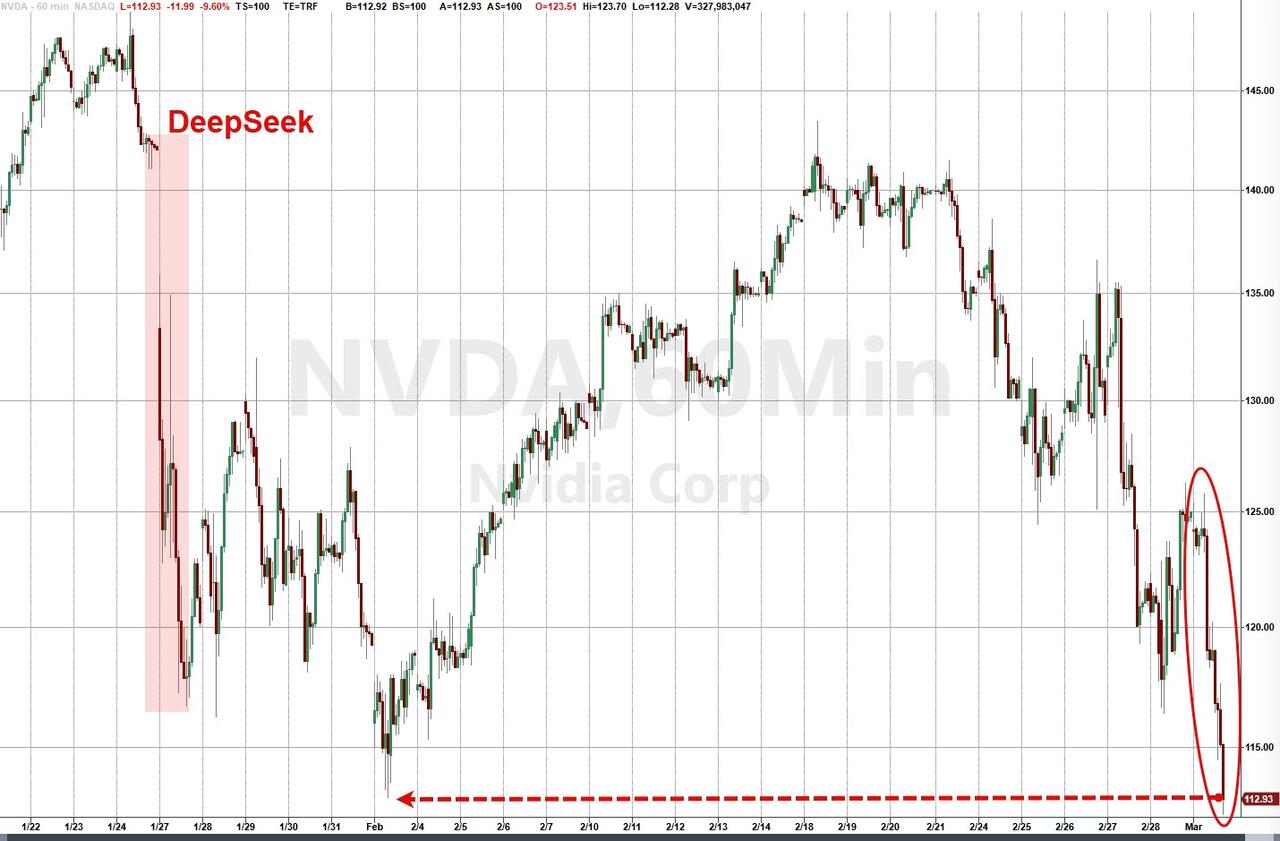
With the Nasdaq leading today’s decline, it’s no surprise that the Mag7 basket took a hit, losing a stunning $570 billion and breaking below its 200 DMA, which could invite more selling. Nvidia tanked, reaching its February lows, with all AI stocks now in the red year-to-date.
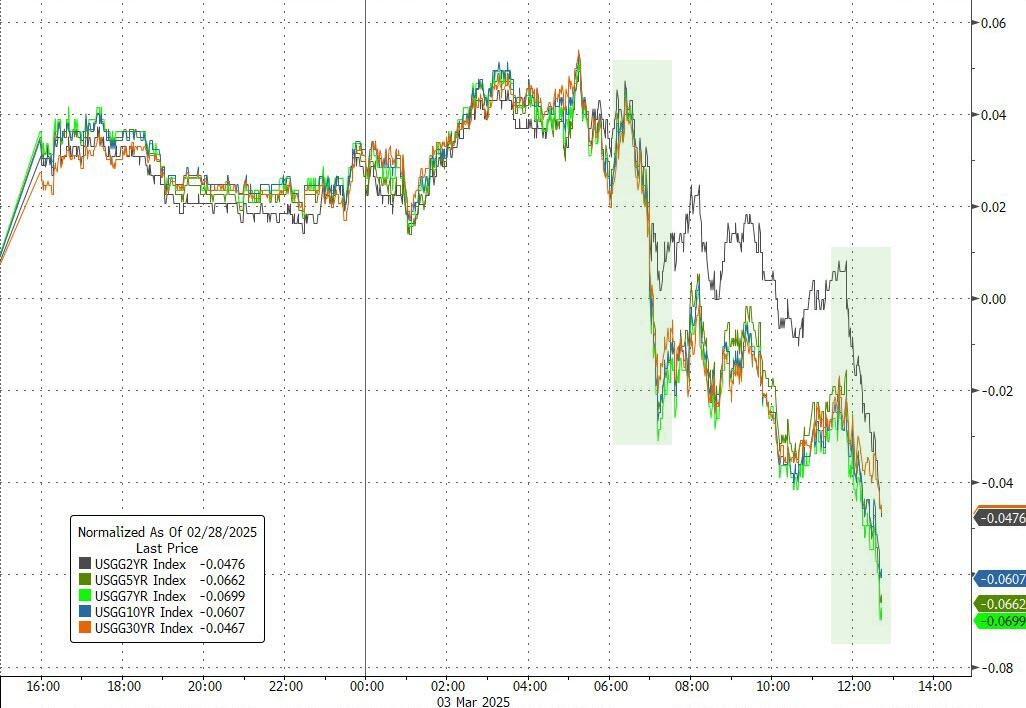
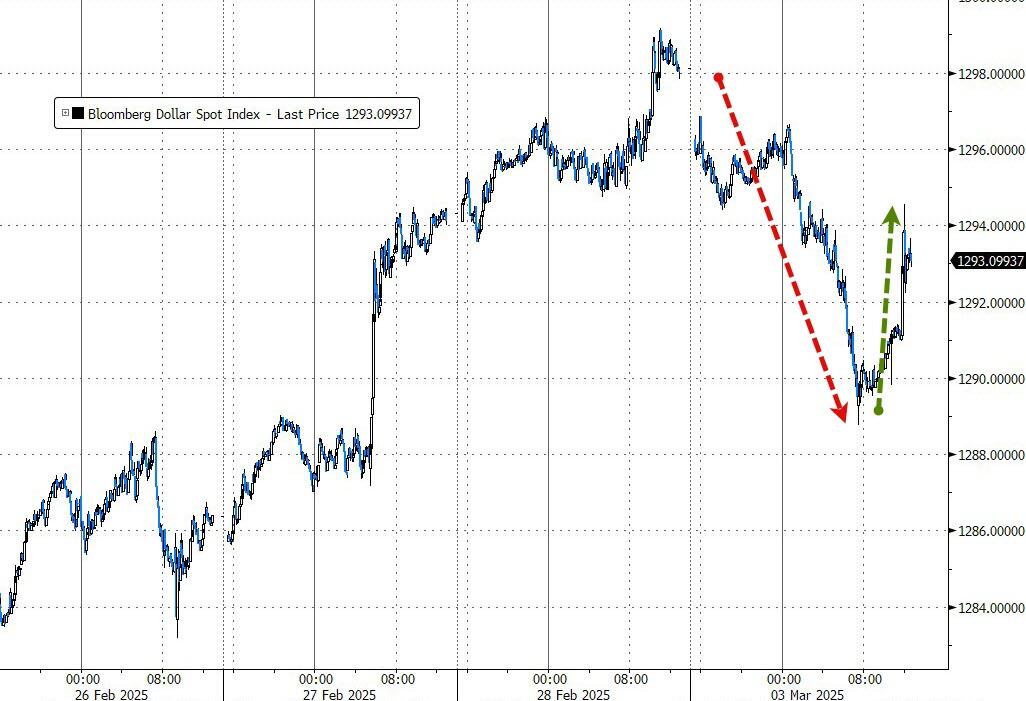
Even plunging bond yields couldn’t stem the downward tide, as the dollar ended lower despite a late session rebound, leaving gold as the only winner for the day, with the precious metal back over the $2,900 level.
With Nvidia appearing to be in retreat mode, this old analog, thanks to ZH, was updated, bringing back the question: Can history repeat itself?
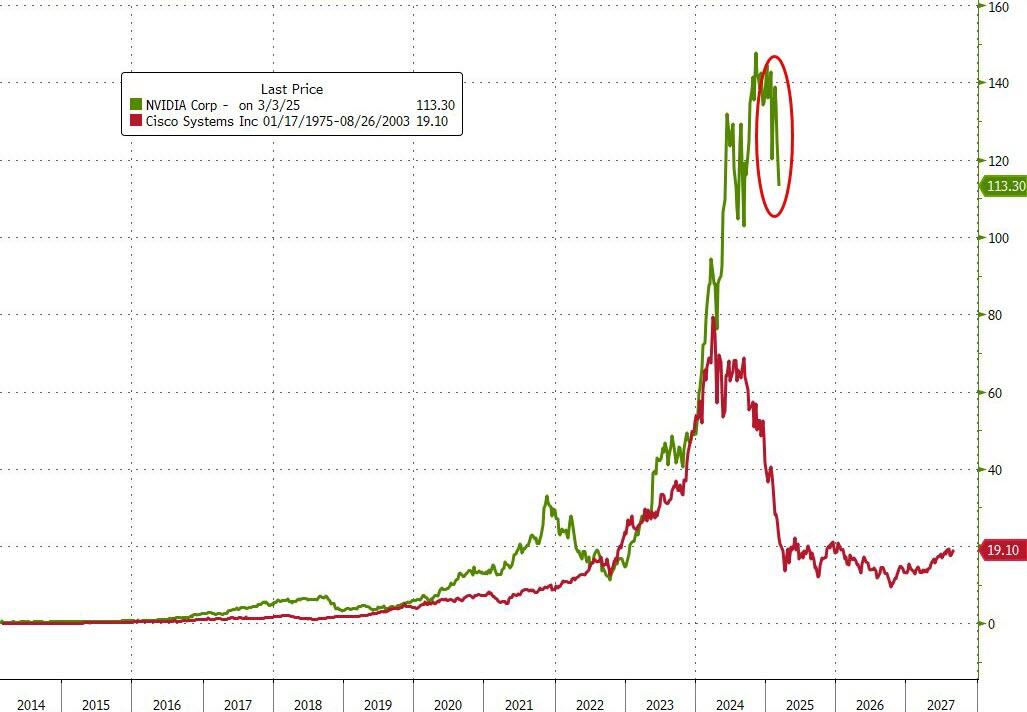
2. Current “Buy” Cycles (effective 11/21/2023)
Our Trend Tracking Indexes (TTIs) have both crossed their trend lines with enough strength to trigger new “Buy” signals. That means, Tuesday, 11/21/2023, was the official date for these signals.
If you want to follow our strategy, you should first decide how much you want to invest based on your risk tolerance (percentage of allocation). Then, you should check my Thursday StatSheet and Saturday’s “ETFs on the Cutline” report for suitable ETFs to buy.
3. Trend Tracking Indexes (TTIs)
In recent times, we’ve often witnessed early bullish sentiment fading quickly, with bearish forces taking control and driving major indexes to close in the red. Today followed this familiar pattern, as the major indexes gave up the gains made on Friday.
Our TTIs showed mixed reactions: the international index gained, while the domestic index declined.
This is how we closed 03/03/2025:
Domestic TTI: +1.90% above its M/A (prior close +3.00%)—Buy signal effective 11/21/2023.
International TTI: +6.48% above its M/A (prior close +6.17%)—Buy signal effective 11/21/2023.
All linked charts above are courtesy of Bloomberg via ZeroHedge.
———————————————————-
WOULD YOU LIKE TO HAVE YOUR INVESTMENTS PROFESSIONALLY MANAGED?
Do you have the time to follow our investment plans yourself? If you are a busy professional who would like to have his portfolio managed using our methodology, please contact me directly to get more details.
Contact Ulli