
- Moving the market
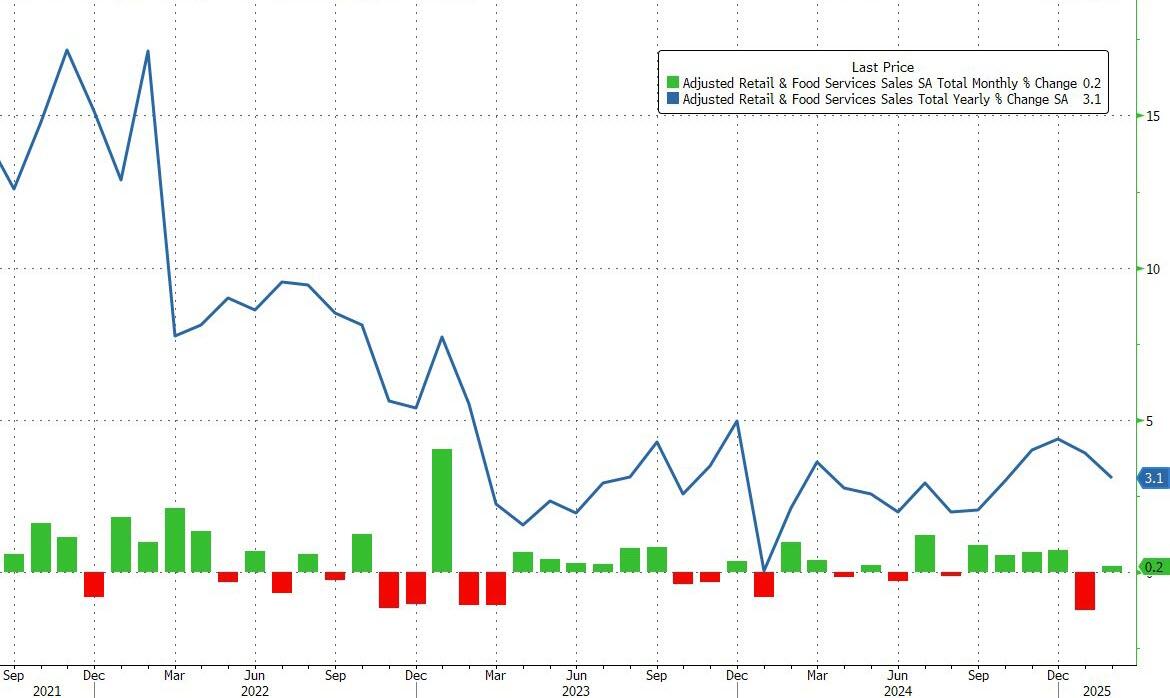
Equities rose early in the session as major indexes attempted to build on Friday’s recovery from correction territory. The latest retail sales report showed a 0.2% increase for February, which, although below the estimated 0.6% rise, relieved traders as the outcome was not worse.
Last Thursday, the S&P 500 entered correction territory, dropping more than 10% from its February high. Dip buyers stepped in on Friday, driving the index 2% higher and helping us delay our “Sell” signal.
Despite this, anxiety persists as traders struggle to keep up with Trump’s rapidly changing tariff policies and the cost-cutting efforts of the DOGE department, which impact the economy and corporate and consumer confidence.
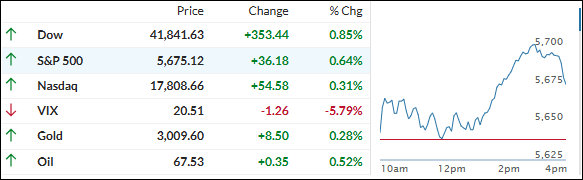
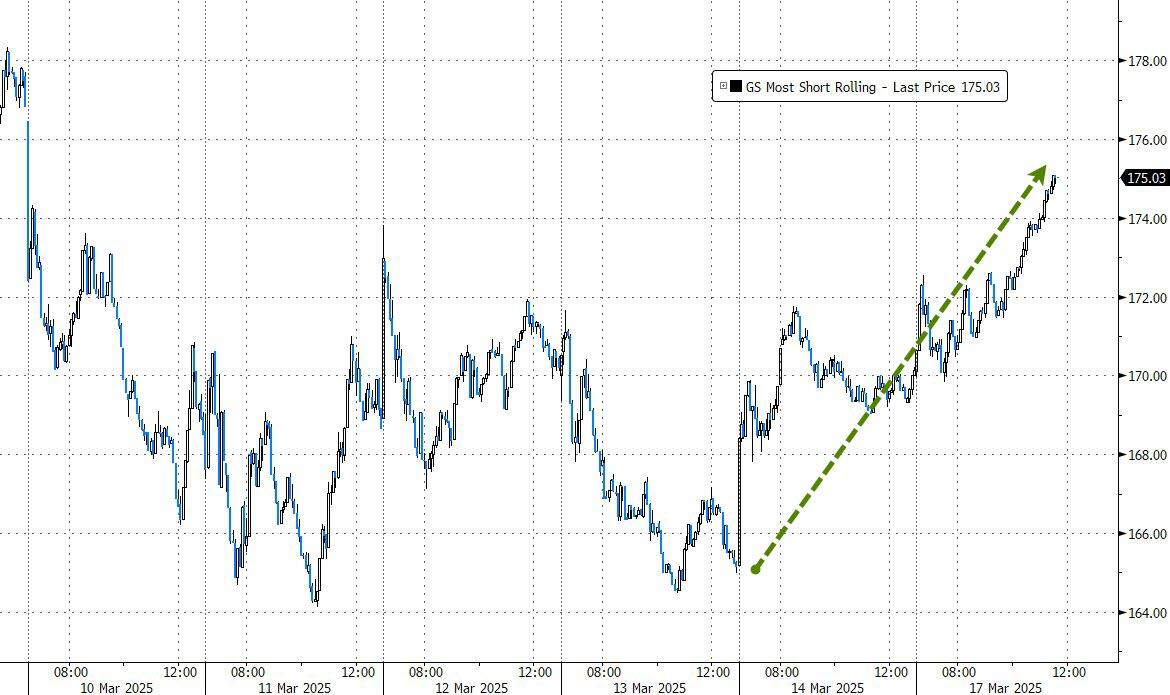
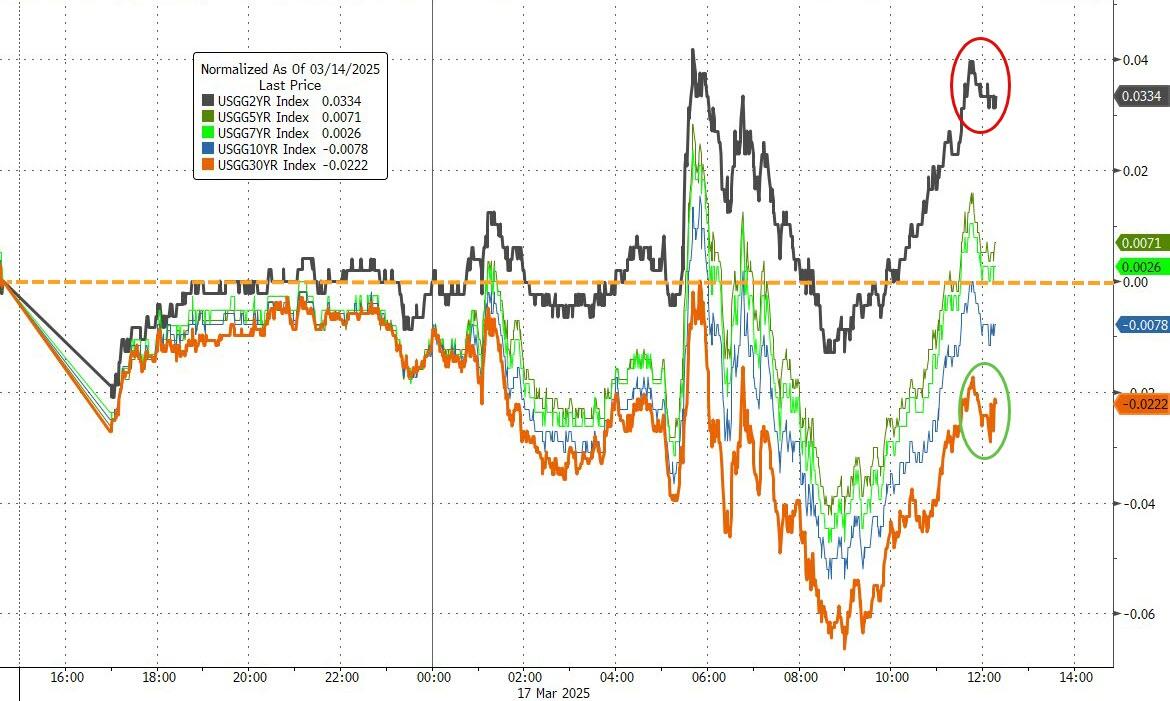
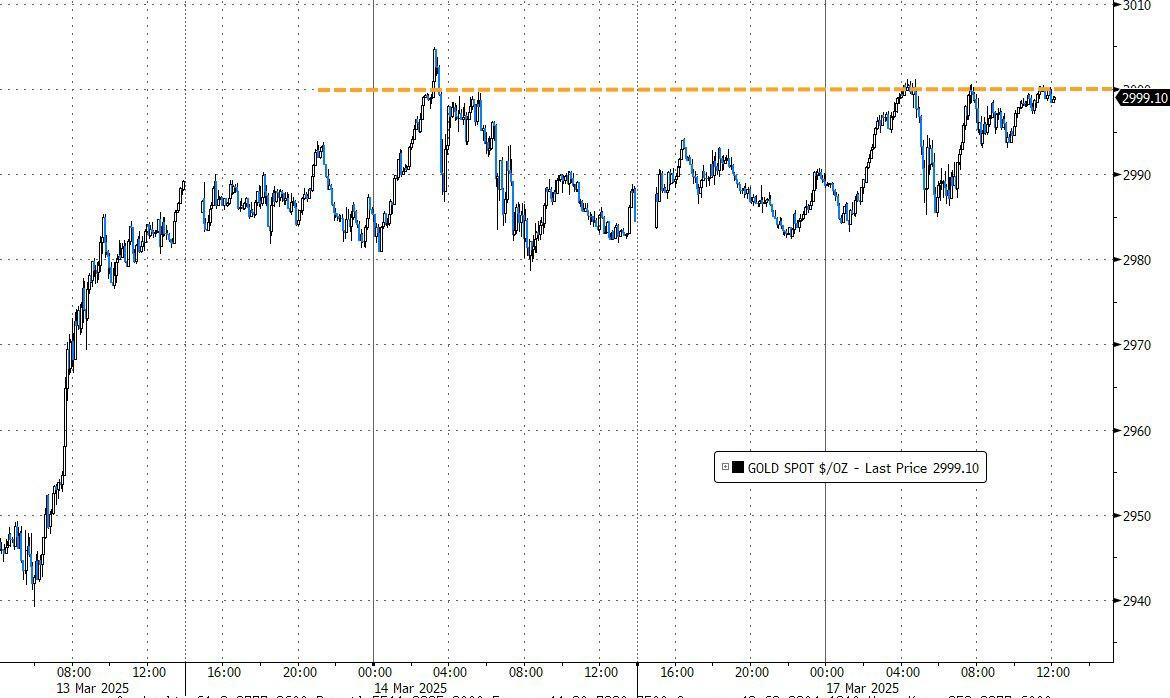
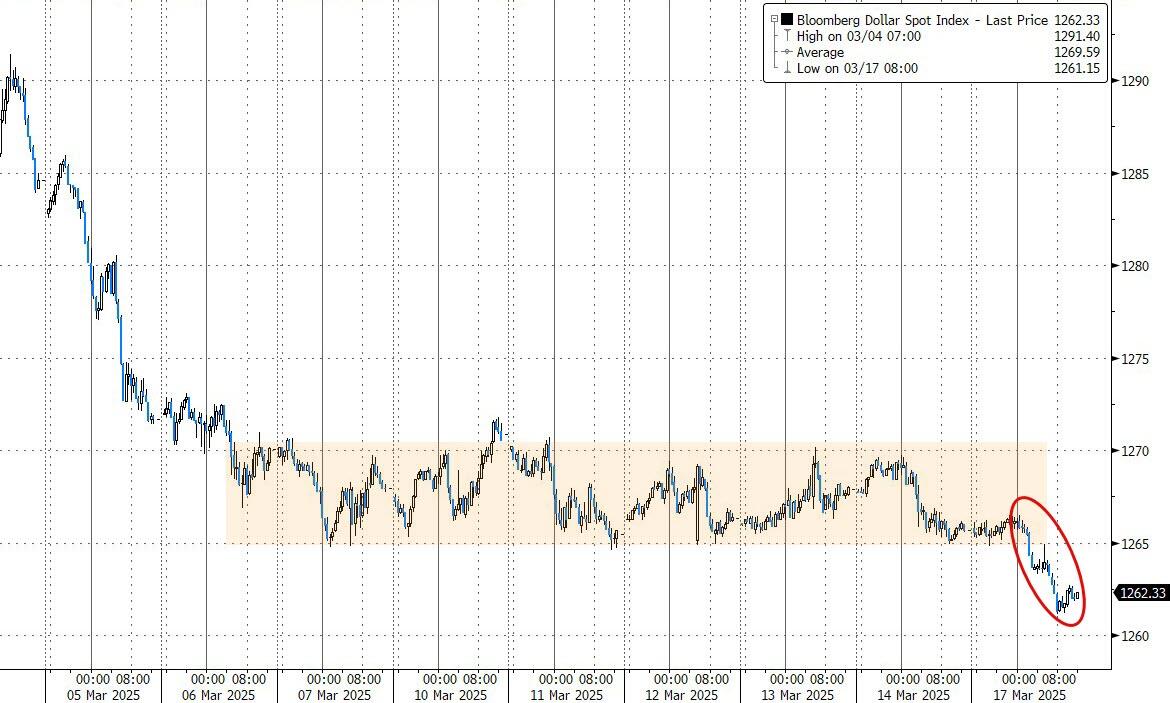
The biggest 2-day short squeeze since last July helped stocks stay on an upward path, despite mixed bond yields. Gold bounced against its $3,000 overhead ceiling and managed to close above it, while the dollar broke below its recent trading range.
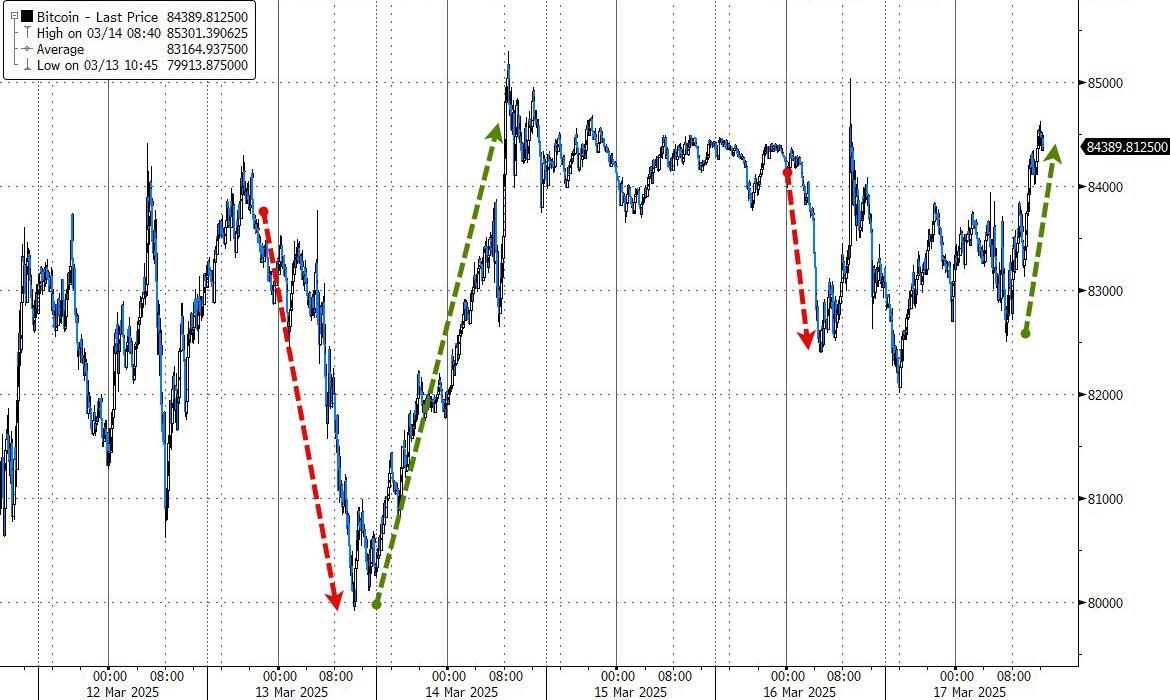
Bitcoin exhibited its usual volatility over the weekend, first falling to $82k before rebounding to nearly $85k.
Our domestic Trend Tracking Index (TTI) surged during the past two sessions, recovering almost all losses from the recent sell-off. See section 3 for more details.
2. Current “Buy” Cycles (effective 11/21/2023)
Our Trend Tracking Indexes (TTIs) have both crossed their trend lines with enough strength to trigger new “Buy” signals. That means, Tuesday, 11/21/2023, was the official date for these signals.
If you want to follow our strategy, you should first decide how much you want to invest based on your risk tolerance (percentage of allocation). Then, you should check my Thursday StatSheet and Saturday’s “ETFs on the Cutline” report for suitable ETFs to buy.
3. Trend Tracking Indexes (TTIs)
Building on Friday’s rebound, the major indexes continued their upward momentum, with equities achieving another solid gain.
Our domestic TTI is now just 0.33% away from crossing its trend line to the upside. If this occurs, it will confirm that the current bull market remains intact.
However, it is yet to be seen if this bounce back has lasting power. Positive sentiment is further supported by the fact that the seasonally weakest period of the year is now behind us.
This is how we closed 03/17/2025:
Domestic TTI: -0.33% below its M/A (prior close -1.66%)—Buy signal effective 11/21/2023.
International TTI: +5.55% above its M/A (prior close +4.40%)—Buy signal effective 11/21/2023.
All linked charts above are courtesy of Bloomberg via ZeroHedge.
———————————————————-
WOULD YOU LIKE TO HAVE YOUR INVESTMENTS PROFESSIONALLY MANAGED?
Do you have the time to follow our investment plans yourself? If you are a busy professional who would like to have his portfolio managed using our methodology, please contact me directly to get more details.
Contact Ulli