

- Moving the market
The much-anticipated Consumer Price Index (CPI) report confirmed to me that the Federal Reserve’s decision to delay rate cuts was an acknowledgment that inflation remains a persistent issue.
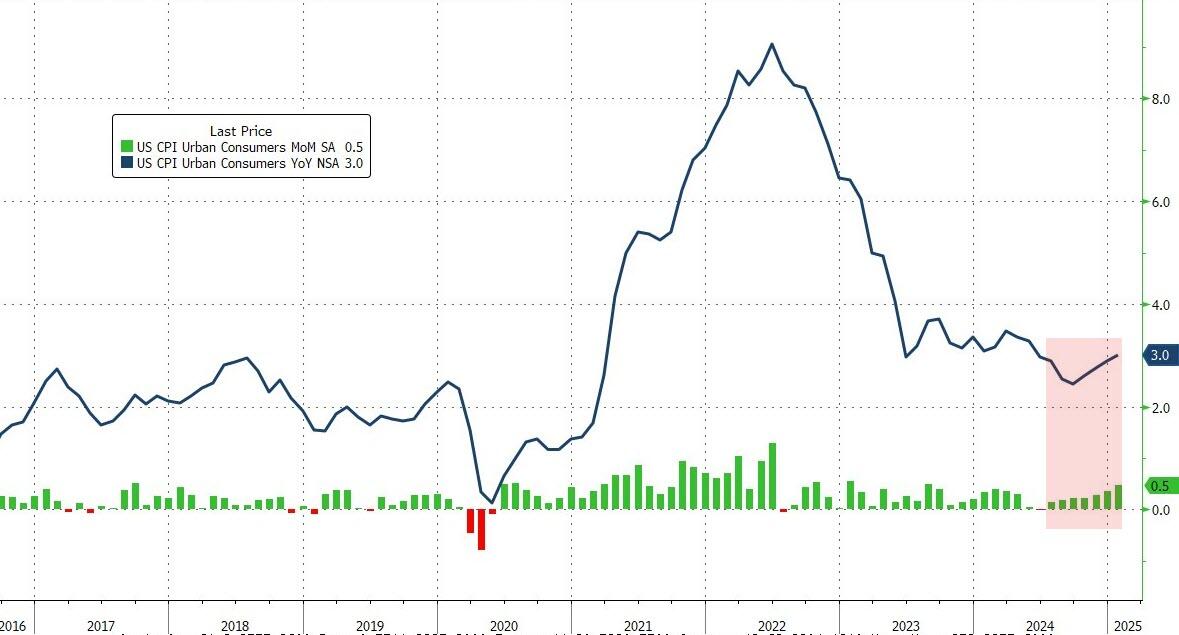
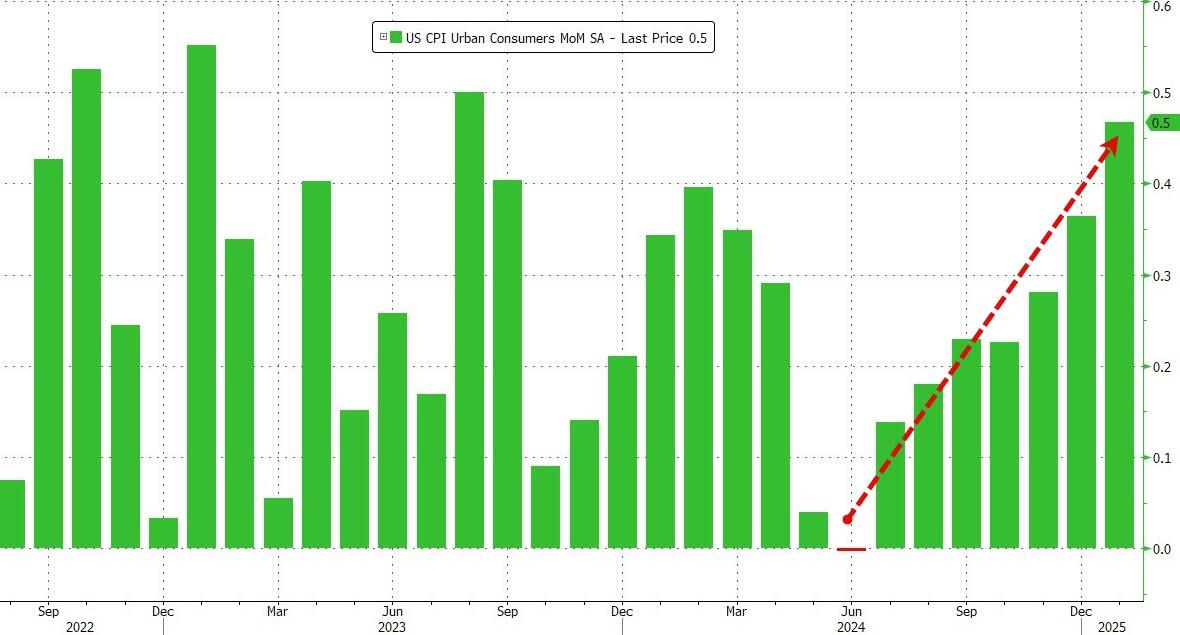
In January, the CPI rose by 0.5% for the month, pushing the annual inflation rate to 3%, surpassing expectations of 0.3% and 2.9%, respectively. The core CPI, which excludes food and energy prices, increased by 0.45% for the month and 3.26% over the past 12 months, also exceeding forecasts.
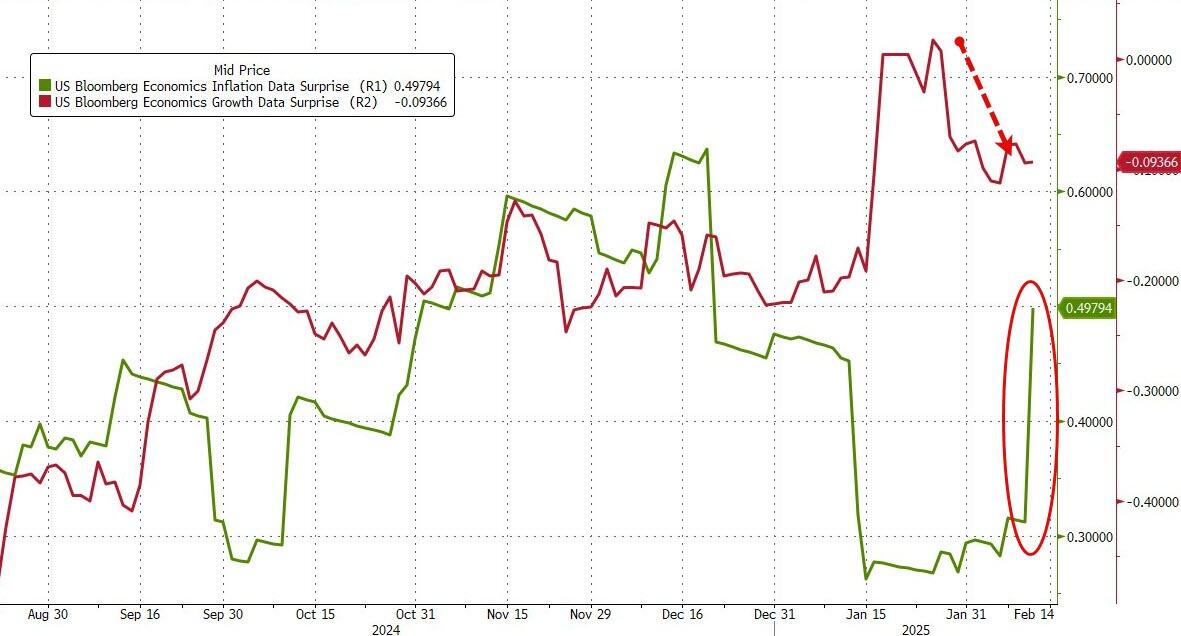
As a result, the 10-year bond yield surged by over 12 basis points to 4.66% early in the session, dampening expectations for rate cuts in 2025. With the CPI rising for seven consecutive months, can it still be considered transitory?
Equities experienced a sharp decline early on, with several mega-cap stocks such as Amazon, Microsoft, and Alphabet falling. Consumer and bank stocks also slid due to concerns over reduced spending and a slowing economy. However, the Nasdaq managed to recover to its starting point.
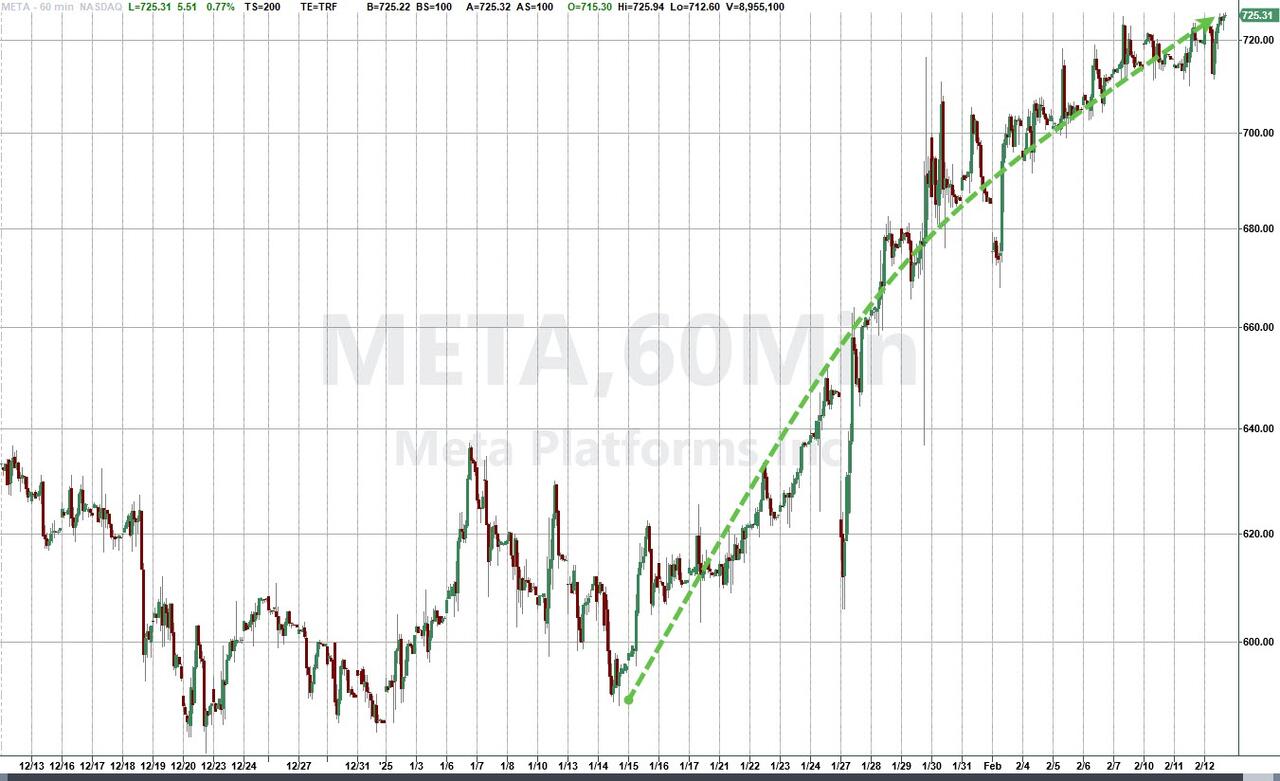
On a positive note, Meta has rallied now for 18 consecutive days, marking the longest winning streak of any Nasdaq stock ever, as highlighted by ZH. During this period, the company has added $300 billion to its market cap.
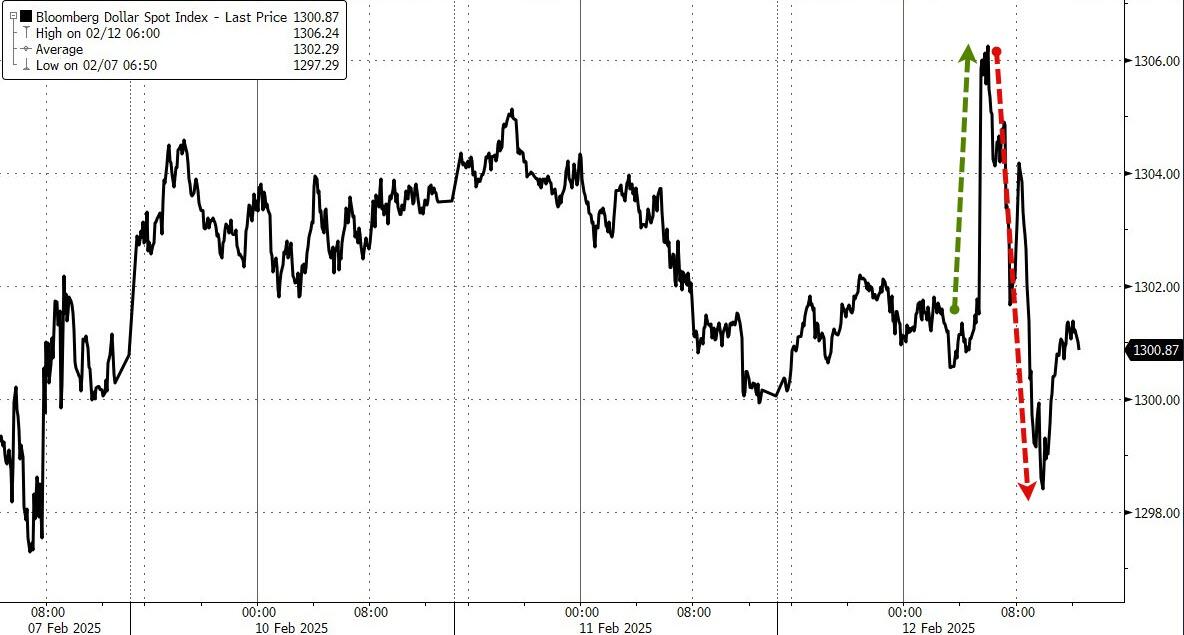
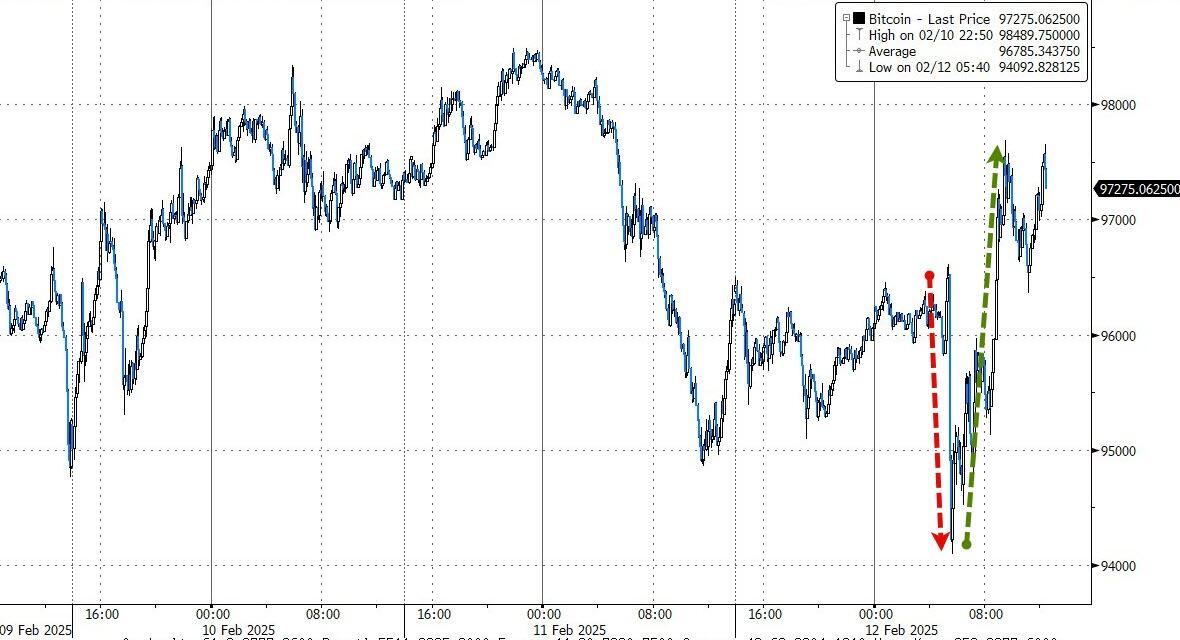
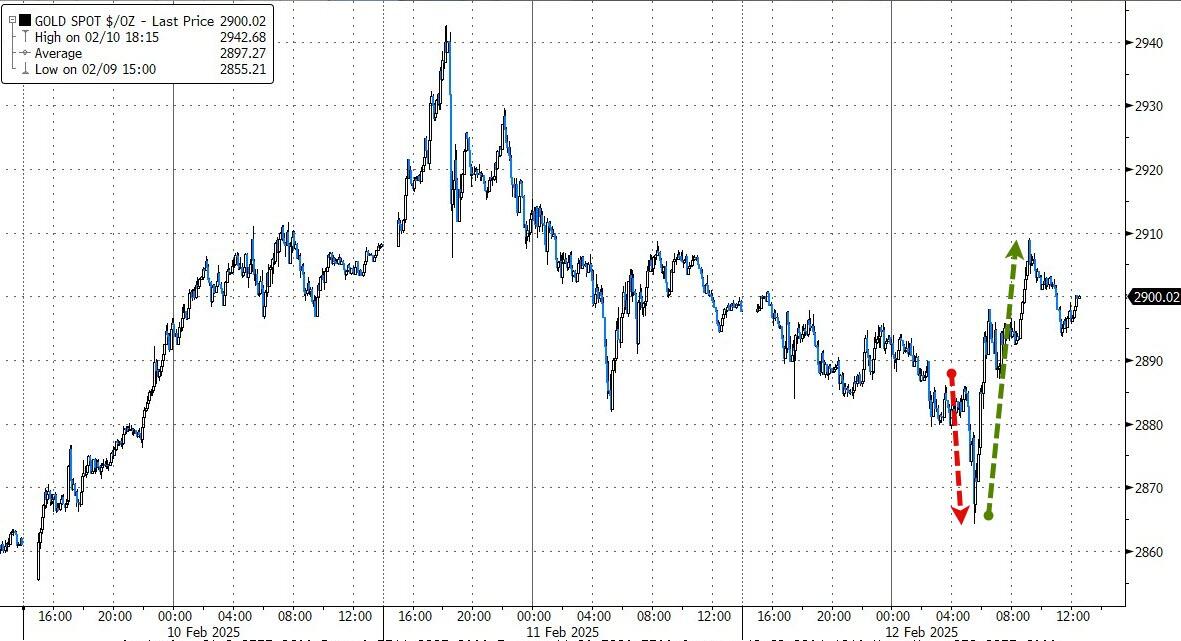
The dollar spiked early in the session but lost all gains by the end, while Bitcoin initially dropped but then rallied back above its $97,000 level. Gold followed a similar pattern, with its ETF eking out a small gain.
As we reach the second half of February, a period that is typically weak seasonally, could this time be different?
2. Current “Buy” Cycles (effective 11/21/2023)
Our Trend Tracking Indexes (TTIs) have both crossed their trend lines with enough strength to trigger new “Buy” signals. That means, Tuesday, 11/21/2023, was the official date for these signals.
If you want to follow our strategy, you should first decide how much you want to invest based on your risk tolerance (percentage of allocation). Then, you should check my Thursday StatSheet and Saturday’s “ETFs on the Cutline” report for suitable ETFs to buy.
3. Trend Tracking Indexes (TTIs)
In the latest trading session, traders encountered the challenging task of pulling equities out of an early decline.
Despite their efforts, the Nasdaq managed to recover to its starting point, while the Dow and S&P 500 ended the day in negative territory.
Our TTIs reflected a mixed outcome, with the international index showing gains and the domestic index experiencing a decline.
This is how we closed 02/12/2025:
Domestic TTI: +3.44% above its M/A (prior close +4.04%)—Buy signal effective 11/21/2023.
International TTI: +6.12% above its M/A (prior close +5.78%)—Buy signal effective 11/21/2023.
All linked charts above are courtesy of Bloomberg via ZeroHedge.
———————————————————-
WOULD YOU LIKE TO HAVE YOUR INVESTMENTS PROFESSIONALLY MANAGED?
Do you have the time to follow our investment plans yourself? If you are a busy professional who would like to have his portfolio managed using our methodology, please contact me directly to get more details.
Contact Ulli