
- Moving the market
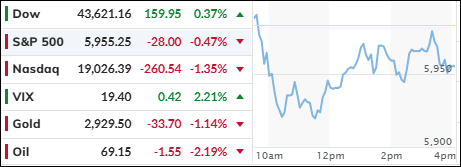
The markets broadly declined, with the S&P 500 falling for the fourth consecutive day and the Nasdaq leading the downturn. The Dow fared the best, managing to close slightly in the green.
Economic concerns took center stage as the latest Consumer Confidence survey plummeted from 105.3 to 98.3, well below the expected 102.5. This marks the lowest level since 2024 and is near the bottom of its range since 2022, as noted by ZH.
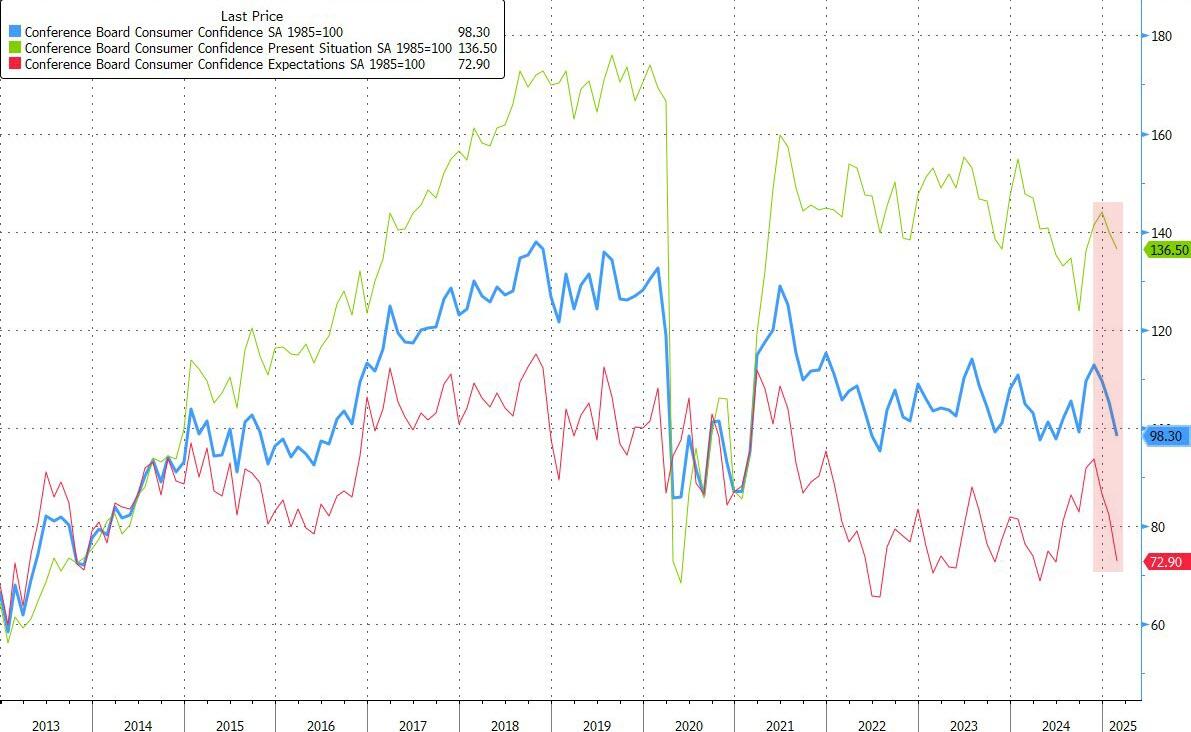
Simultaneously, inflation expectations surged, highlighting the risk of “Stagflation”—a scenario I’ve frequently mentioned. This comes on the heels of flat manufacturing and retail sales reports.
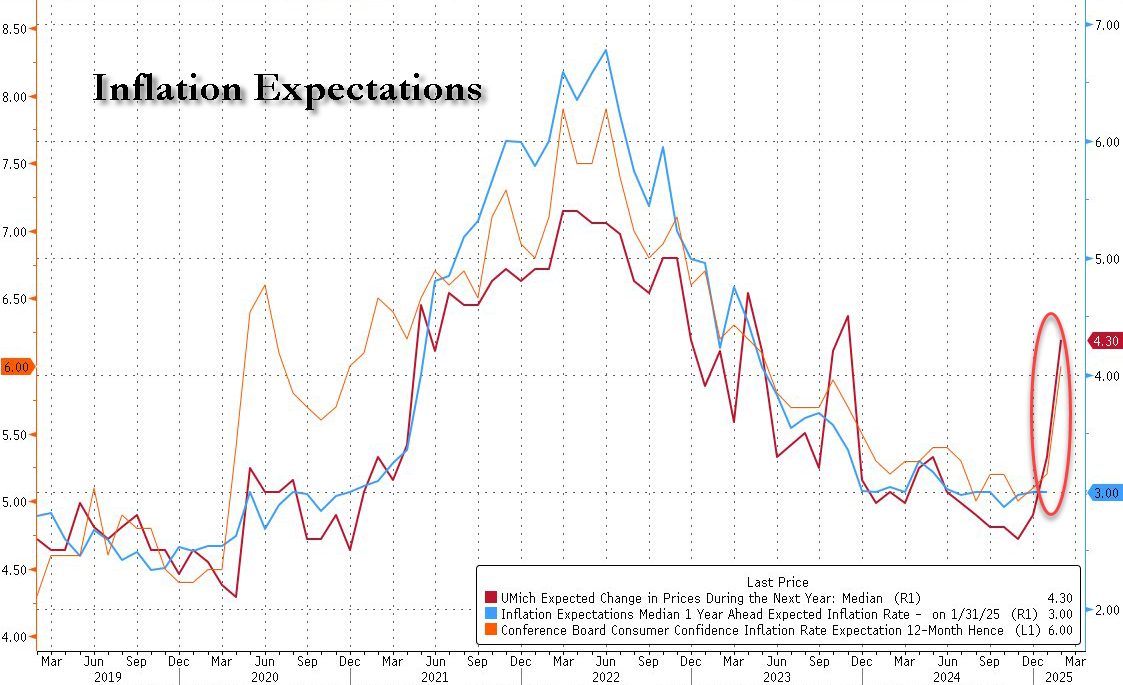
Trade tensions are escalating, with tariffs on Canada and Mexico set to proceed after the current 30-day moratorium ends. Traders will need to find new catalysts to lift equities out of their slump.
Despite a nearly 12 basis point drop in the 10-year bond yield to 4.30%, comeback attempts failed today. All bond yields ended lower, with bonds serving as a safe haven.
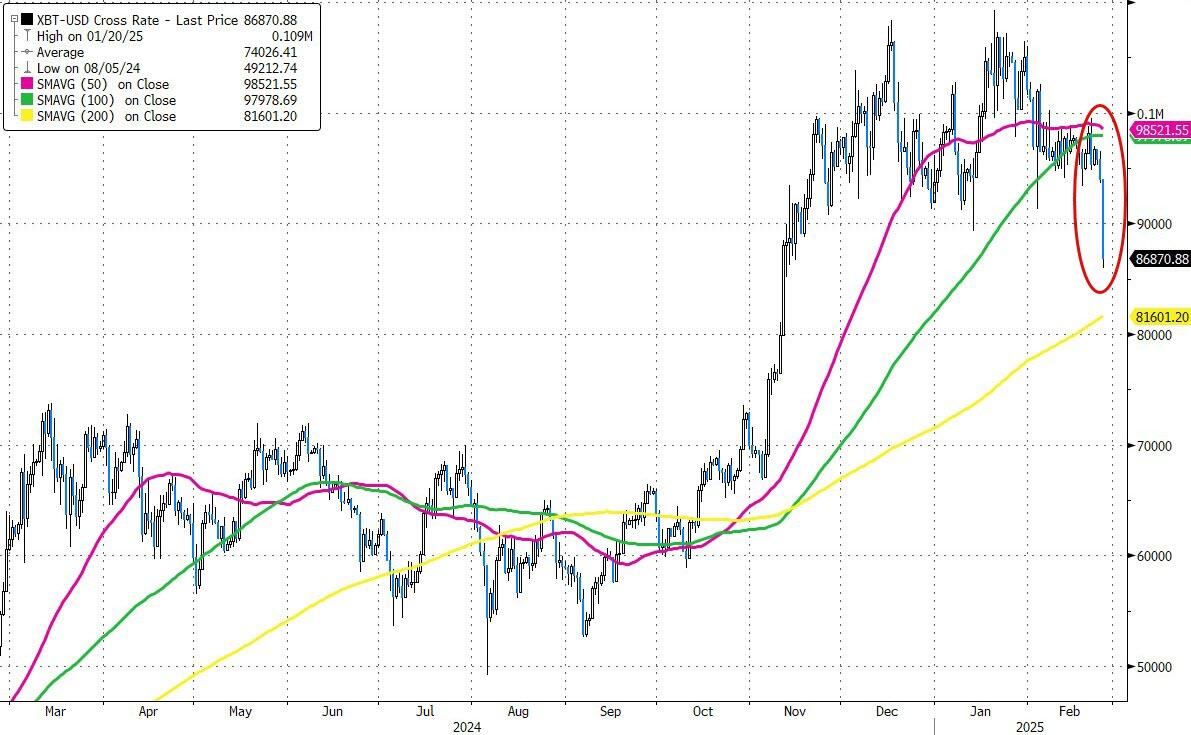
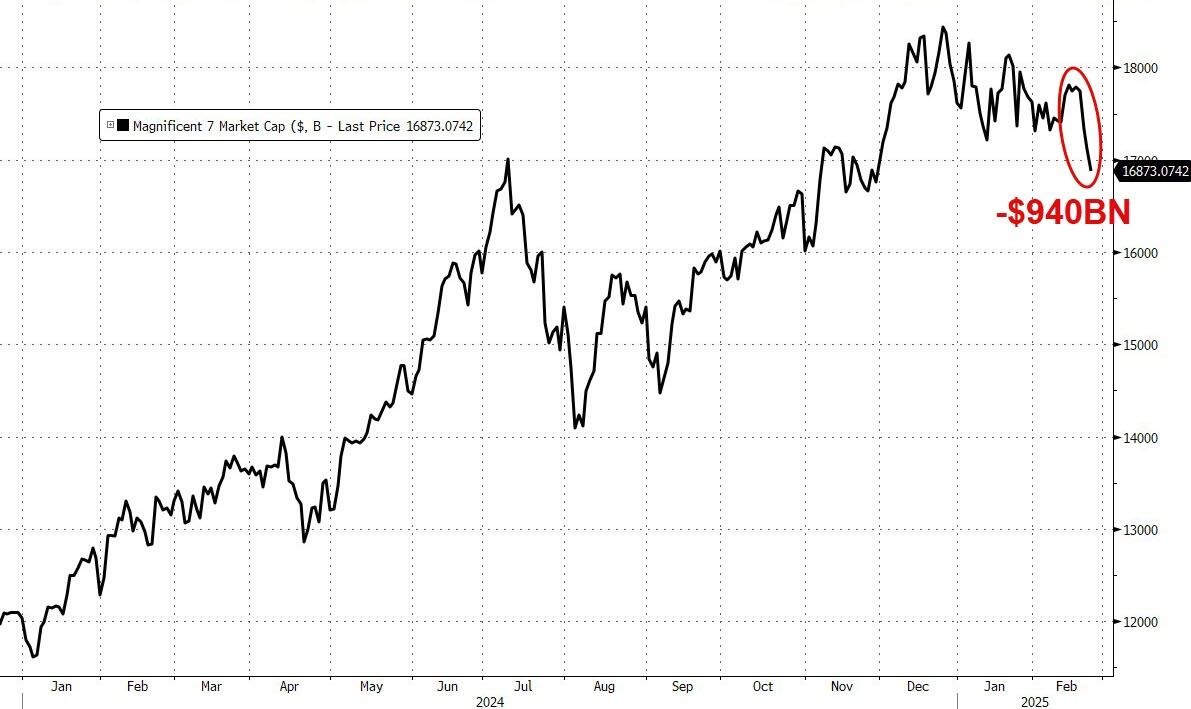
Bitcoin ETF outflows continued, dragging the cryptocurrency below $90k. All markets experienced heavy selling, typical of the seasonally weakest period of the year. Even the Mag 7 stocks suffered, losing $1.5 trillion in market cap year-to-date and over $900 billion in the past week.
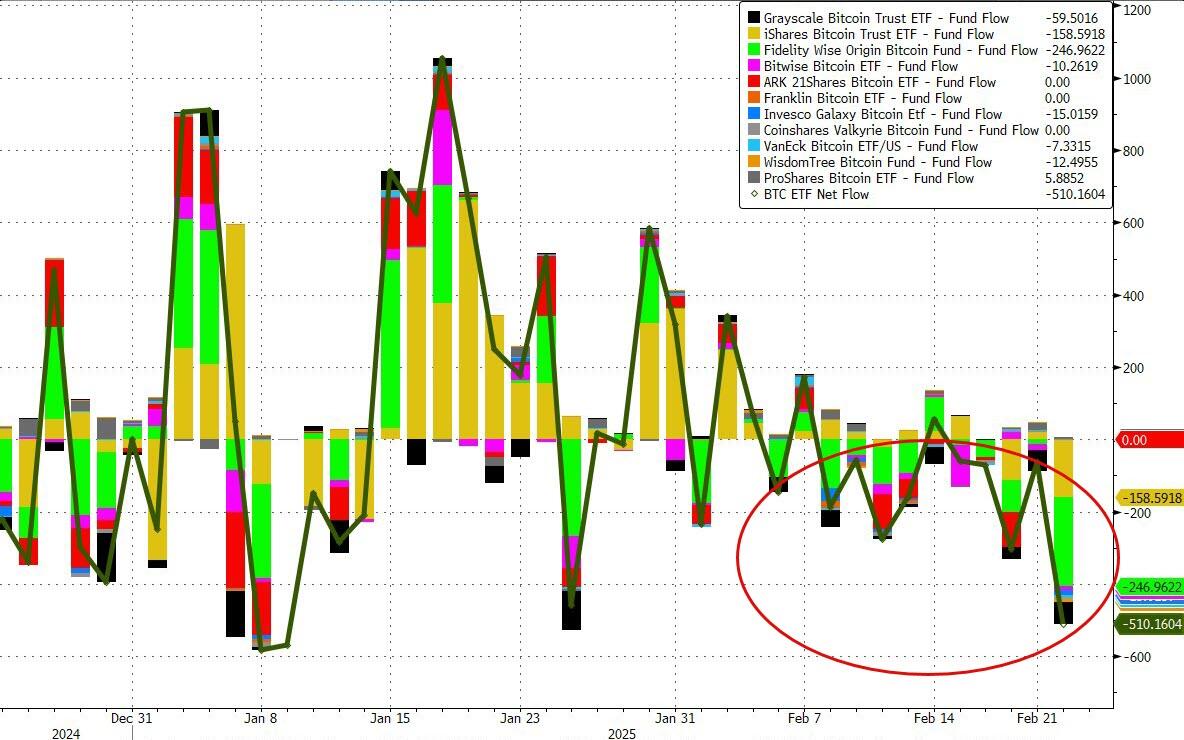
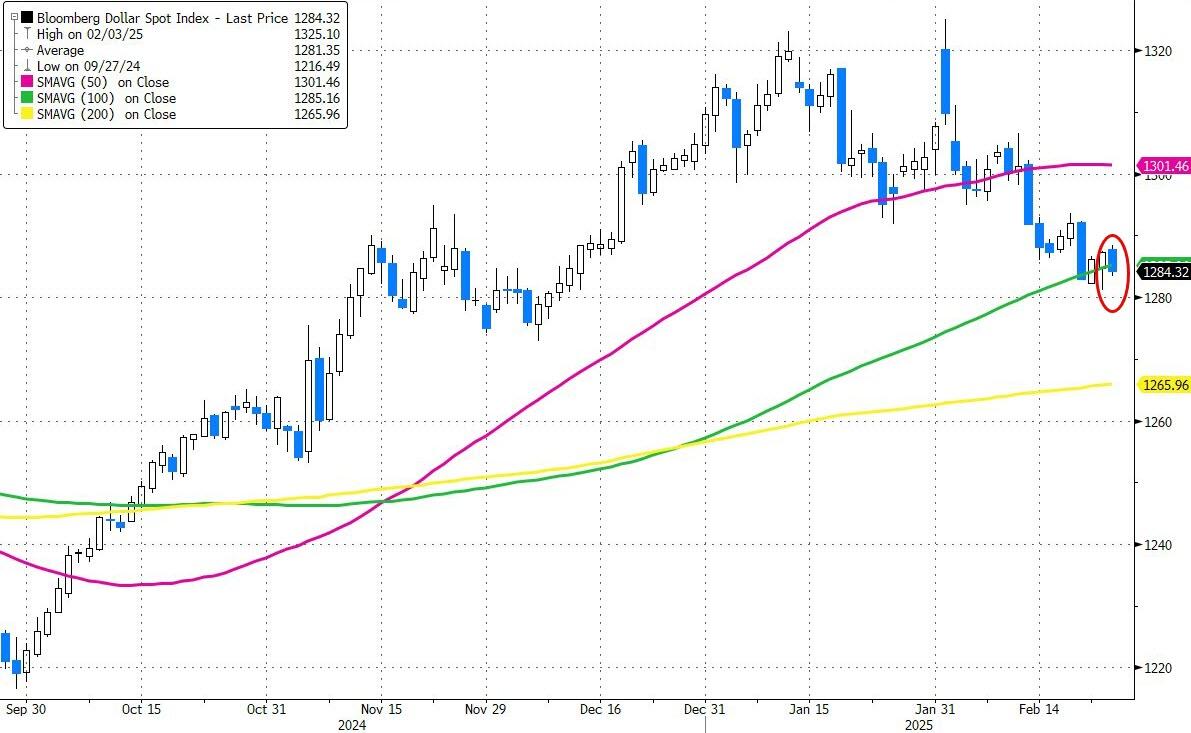
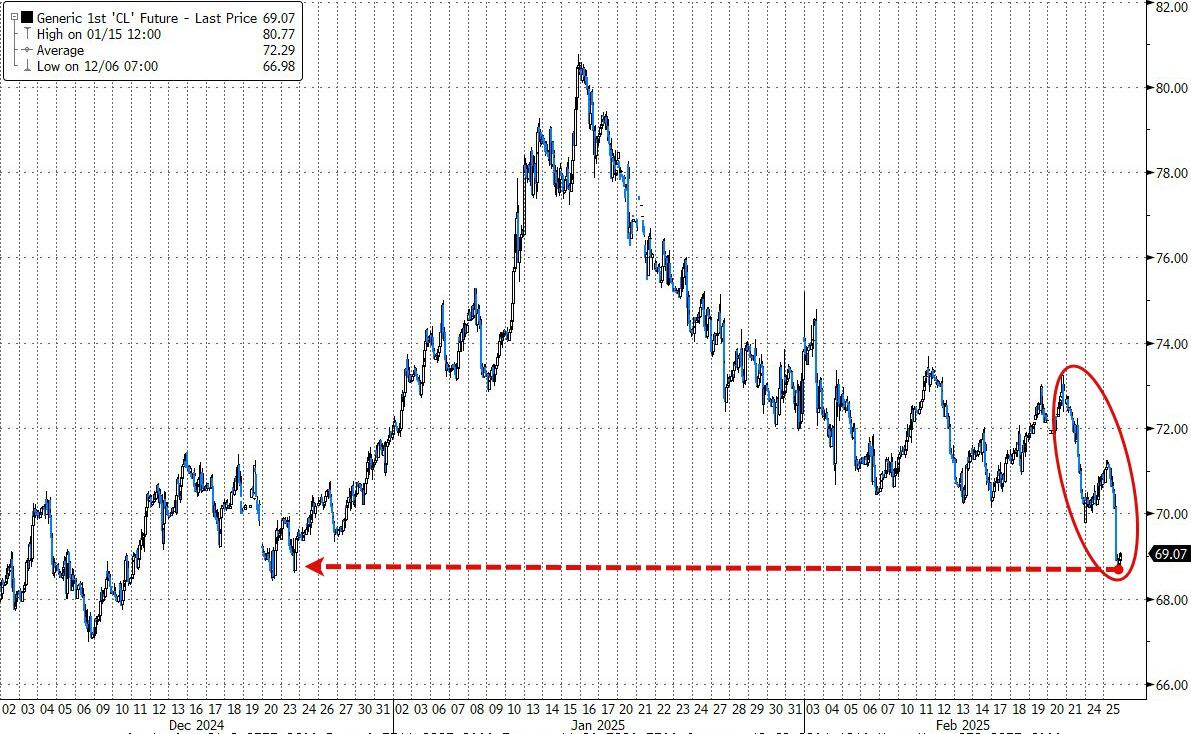
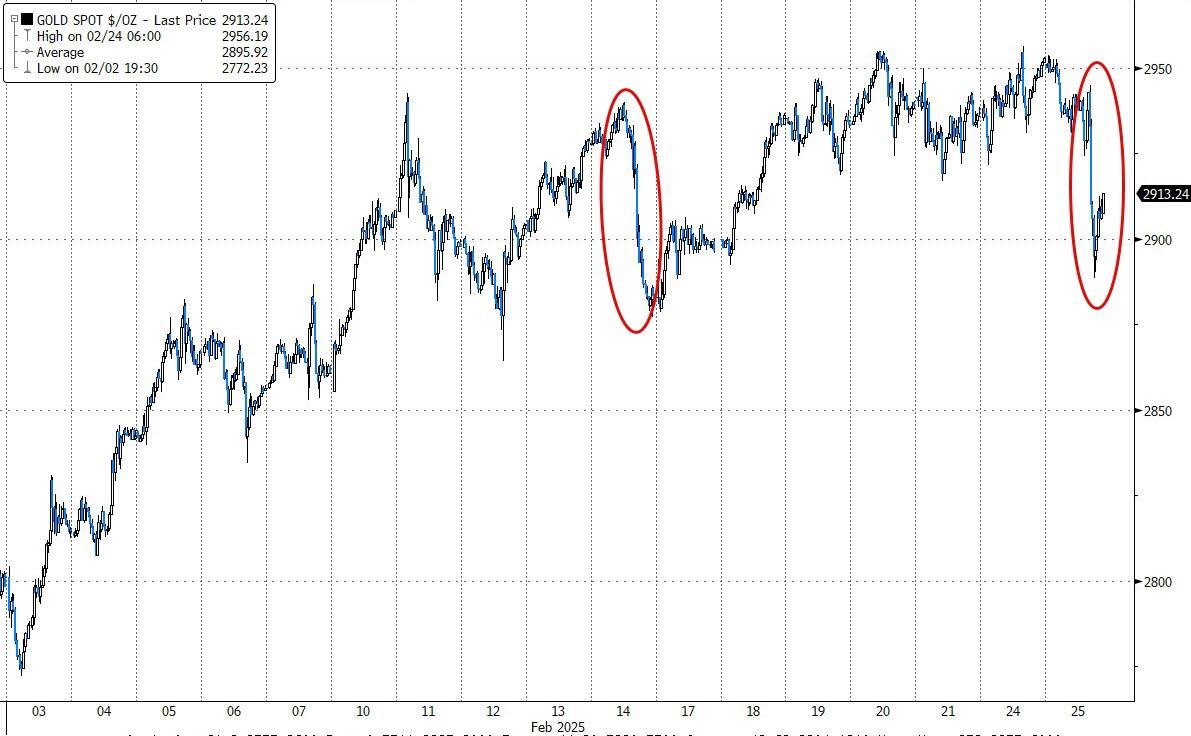
The dollar declined, breaking its 100-day moving average, while oil prices plunged below $70. Gold also retreated amid growing uncertainty but held above the $2,900 level.
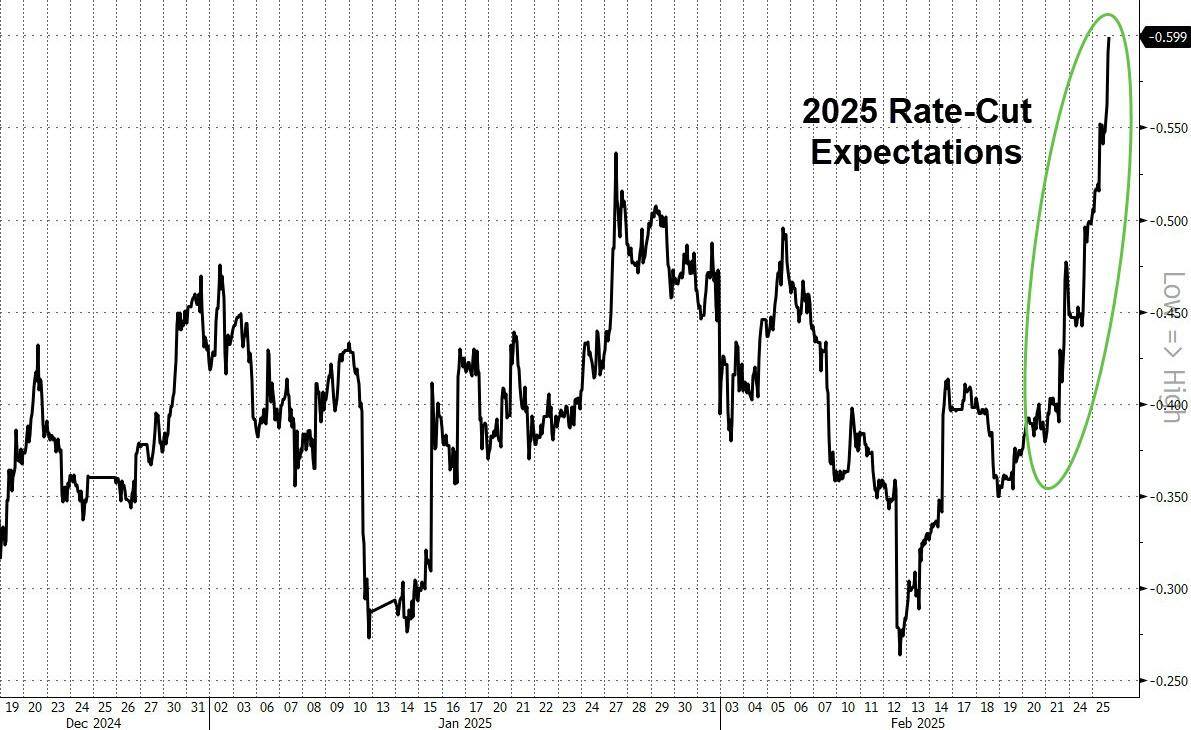
The growth scare has increased expectations for rate cuts amid calls for lower rates. Will the Fed respond?
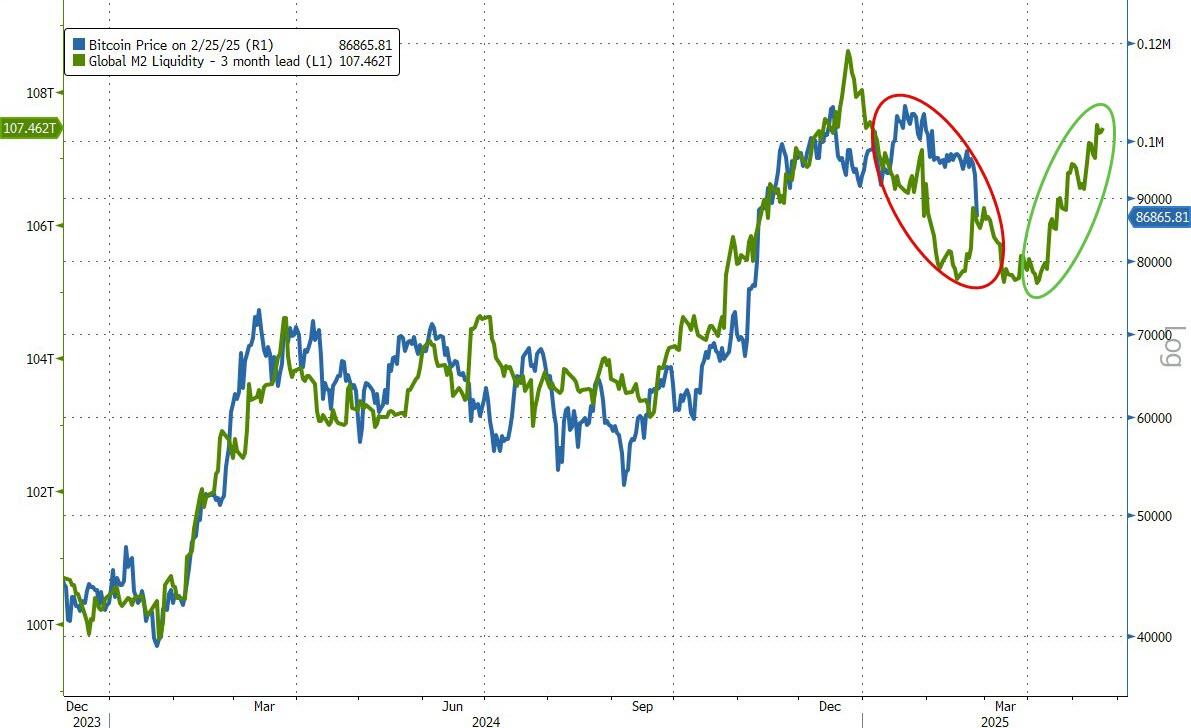
It’s fascinating to me to observe the synchronized behavior of Bitcoin and global liquidity with a slight lag. As this chart shows, Bitcoin could drop as low as $80k before rebounding and heading back toward record highs.
Will history repeat itself?
2. Current “Buy” Cycles (effective 11/21/2023)
Our Trend Tracking Indexes (TTIs) have both crossed their trend lines with enough strength to trigger new “Buy” signals. That means, Tuesday, 11/21/2023, was the official date for these signals.
If you want to follow our strategy, you should first decide how much you want to invest based on your risk tolerance (percentage of allocation). Then, you should check my Thursday StatSheet and Saturday’s “ETFs on the Cutline” report for suitable ETFs to buy.
3. Trend Tracking Indexes (TTIs)
The market opened with a lack of bullish sentiment, leading to a decline in the major indexes. Although there were some attempts at recovery, only the Dow managed to close in positive territory.
Meanwhile, our TTIs defied the overall downtrend, finishing the session with moderate gains.
This is how we closed 02/25/2025:
Domestic TTI: +3.23% above its M/A (prior close +3.12%)—Buy signal effective 11/21/2023.
International TTI: +6.97% above its M/A (prior close +6.75%)—Buy signal effective 11/21/2023.
All linked charts above are courtesy of Bloomberg via ZeroHedge.
———————————————————-
WOULD YOU LIKE TO HAVE YOUR INVESTMENTS PROFESSIONALLY MANAGED?
Do you have the time to follow our investment plans yourself? If you are a busy professional who would like to have his portfolio managed using our methodology, please contact me directly to get more details.
Contact Ulli