
- Moving the market
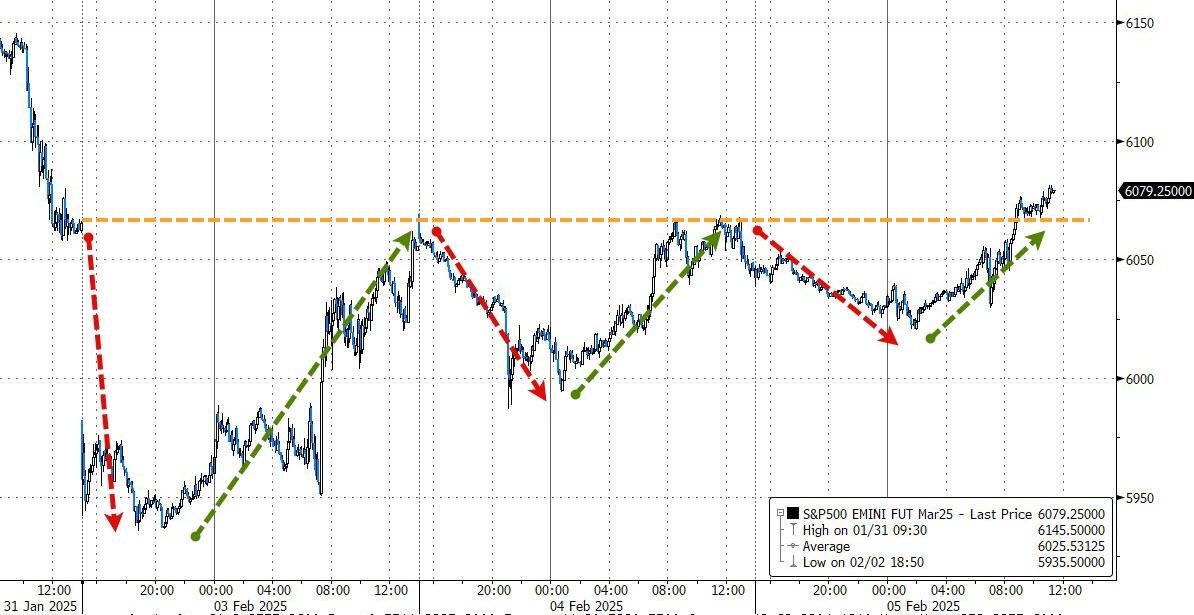
Mixed quarterly results from Alphabet and chipmaker AMD (-6%) negatively impacted the S&P 500 and Nasdaq, causing both indices to dip below their respective unchanged lines.
However, by the end of the session, both managed to recover and close with moderate gains, marking a “dump and pump” kind of day.
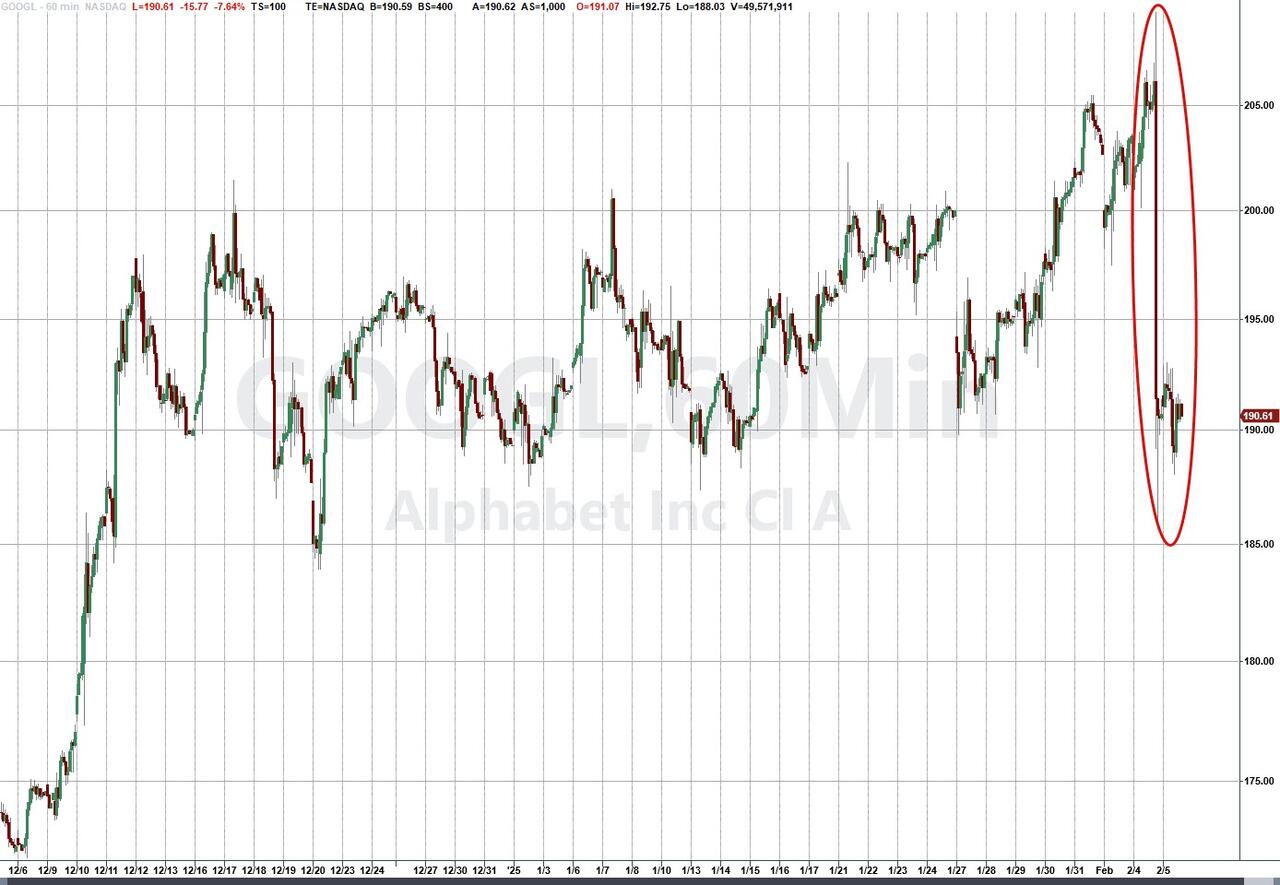
Alphabet shares fell by 8% after reporting a miss in cloud revenue, as the company increased its spending on artificial intelligence. This raised concerns among traders that Alphabet might take longer than expected to achieve its AI objectives.
The competition to bring AI to the masses is fierce, with hundreds of billions being invested in these efforts. However, it remains uncertain who will emerge victorious in this race.
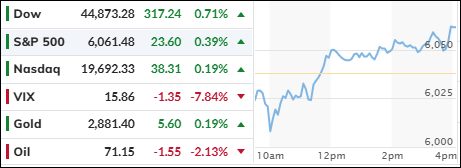
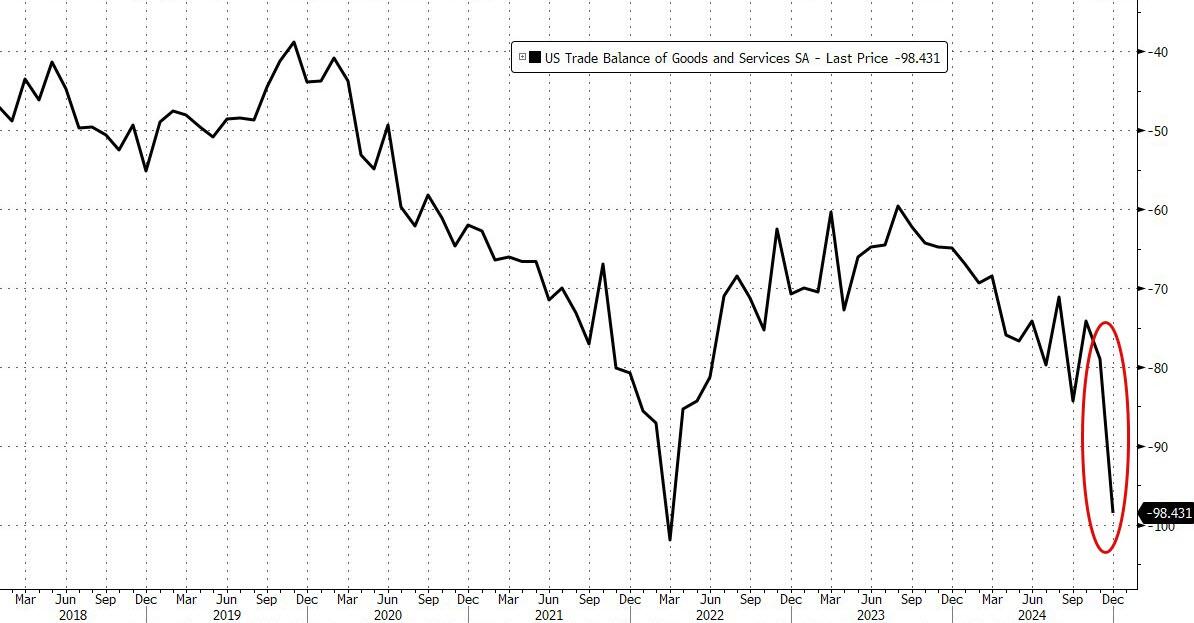
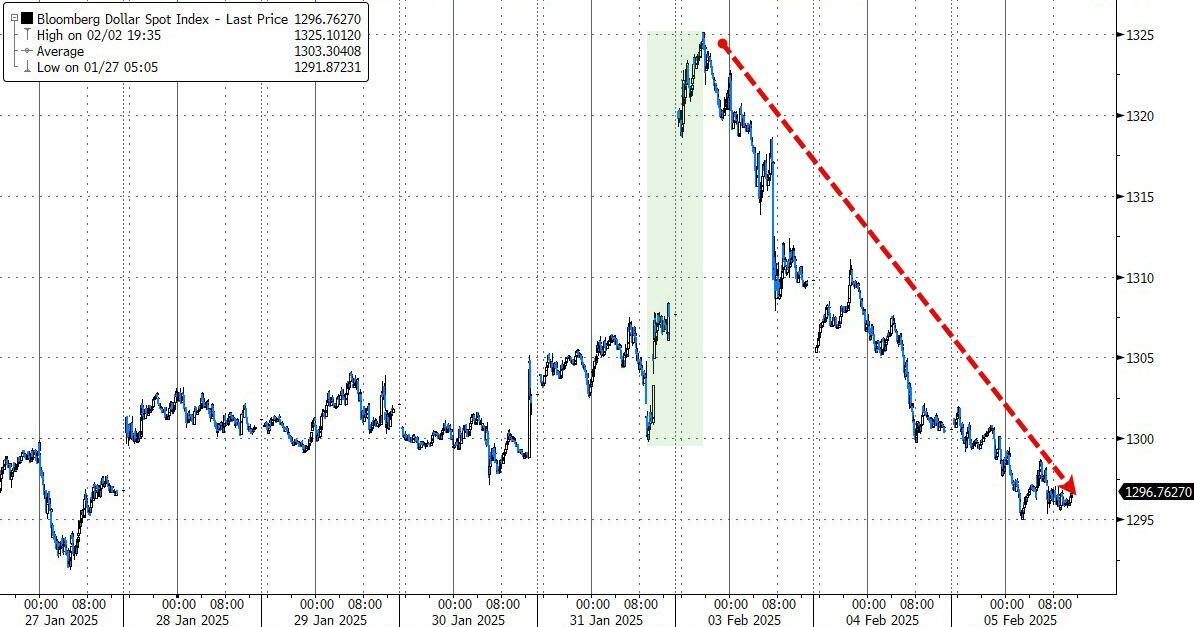
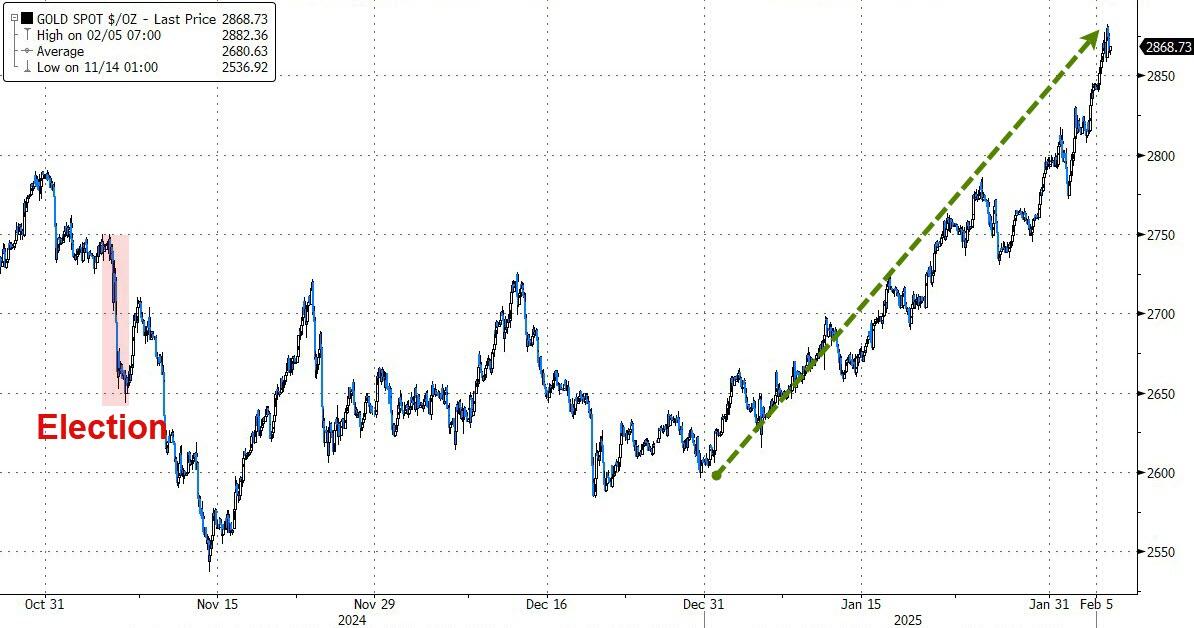
The trade deficit’s downside blowout contributed to the dollar’s continued slide, while gold surged towards the $3,000 mark, setting another record high.
This rise in gold prices is partly due to a shortage of freely available gold, with one precious metals dealer commenting on the market’s total dislocation and the scarcity of available stocks in both gold and silver.
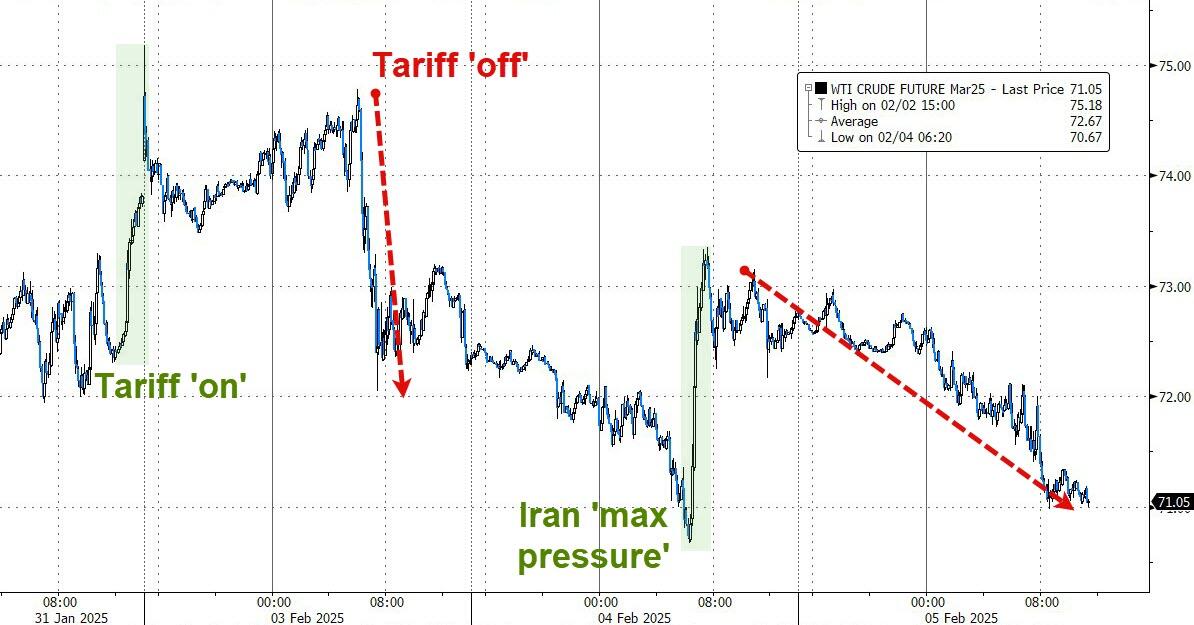
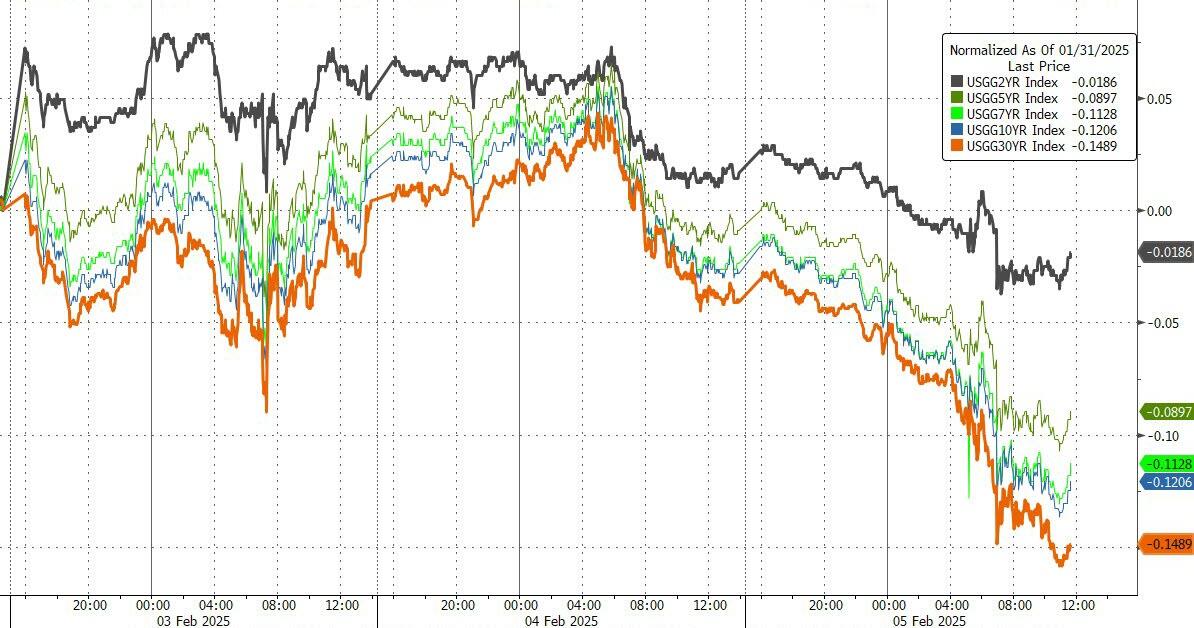
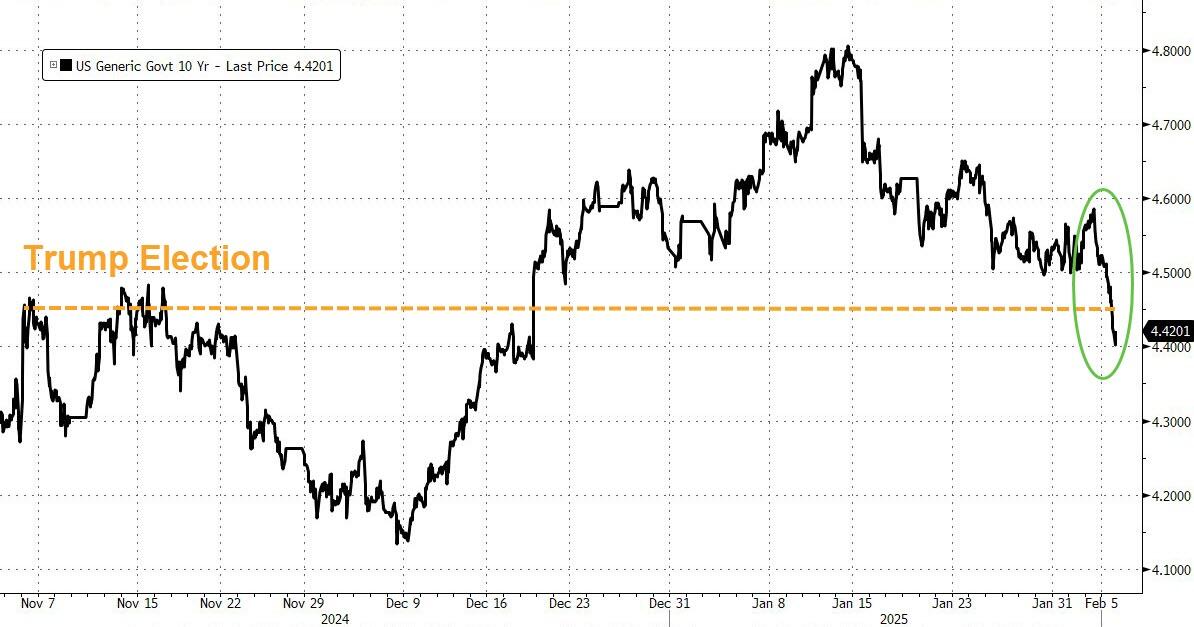
Crude oil prices declined, and bond yields retreated, with the 10-year yield dropping below the initial spike seen after Trump’s election.
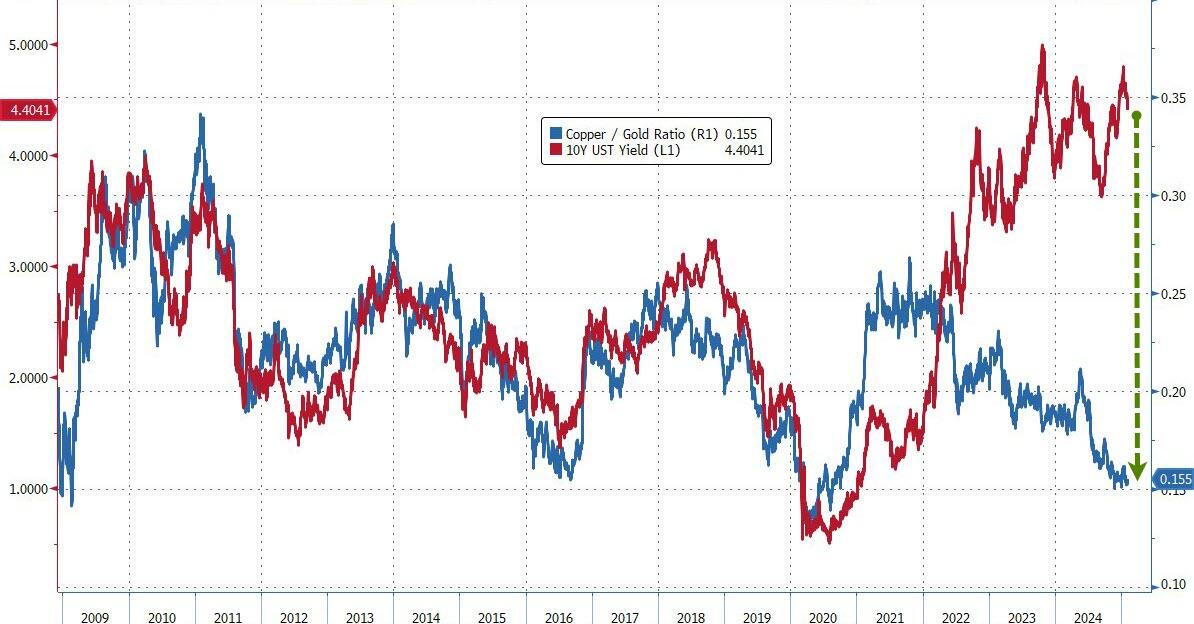
Confusion reigns in the commodities market, particularly when observing the divergence between copper prices and bond yields, as noted by ZH.
Which direction will the market take next?
2. Current “Buy” Cycles (effective 11/21/2023)
Our Trend Tracking Indexes (TTIs) have both crossed their trend lines with enough strength to trigger new “Buy” signals. That means, Tuesday, 11/21/2023, was the official date for these signals.
If you want to follow our strategy, you should first decide how much you want to invest based on your risk tolerance (percentage of allocation). Then, you should check my Thursday StatSheet and Saturday’s “ETFs on the Cutline” report for suitable ETFs to buy.
3. Trend Tracking Indexes (TTIs)
Although the trading day began with some uncertainty, both the S&P 500 and Nasdaq managed to recover their upward momentum, ultimately closing the session on a positive note.
In contrast, our TTIs demonstrated greater stability throughout the day, ending in a solidly higher close.
This is how we closed 02/05/2025:
Domestic TTI: +4.63% above its M/A (prior close +4.13%)—Buy signal effective 11/21/2023.
International TTI: +5.21% above its M/A (prior close +4.42%)—Buy signal effective 11/21/2023.
All linked charts above are courtesy of Bloomberg via ZeroHedge.
———————————————————-
WOULD YOU LIKE TO HAVE YOUR INVESTMENTS PROFESSIONALLY MANAGED?
Do you have the time to follow our investment plans yourself? If you are a busy professional who would like to have his portfolio managed using our methodology, please contact me directly to get more details.
Contact Ulli