ETF Tracker StatSheet
You can view the latest version here.
MARKET RALLIES AS TRADERS SHAKE OFF LOSING STREAK

- Moving the market
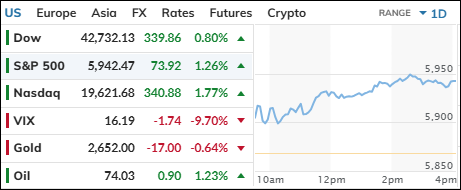
Early in the session, the broad market rallied as traders attempted to shake off a five-day losing streak and overcome a volatile start to 2025. Their efforts finally paid off.
Nvidia led the tech sector with a solid 4.5% advance, while the consumer discretionary sector also posted gains. Profit-taking has been central to the recent pullback, with significant 2024 performers like Apple and Tesla experiencing temporary hits.
The year 2024 ended on a sour note for the S&P 500. Despite achieving a 23% gain for the year, the index lost 2.5% in December and ended the month with four consecutive days of losses, thereby neutralizing the much-anticipated Santa Claus rally.
On the economic front, US manufacturing remained in contraction mode after a challenging end to 2024, with optimism for growth in the year ahead waning. The primary reason was an increased rate of production cuts in December due to a disappointing inflow of new orders.
The most shorted stocks were sharply squeezed, providing a boost to equities, with the Mega-Cap tech basket also participating. Bond yields slipped for the week, while the dollar continued its relentless rally.
Bitcoin had its best week since Thanksgiving, nearly recouping its $99k level. Despite retreating today, gold ignored the strong dollar and recorded its best week since Thanksgiving as well.
A crack in consumer spending emerged as credit card defaults surged 50% from last year, reaching their highest levels since 2008. With the consumer contributing 67% of GDP, how will this affect future growth?
Does this indicate we might see a shrinking economy?
2. Current “Buy” Cycles (effective 11/21/2023)
Our Trend Tracking Indexes (TTIs) have both crossed their trend lines with enough strength to trigger new “Buy” signals. That means, Tuesday, 11/21/2023, was the official date for these signals.
If you want to follow our strategy, you should first decide how much you want to invest based on your risk tolerance (percentage of allocation). Then, you should check my Thursday StatSheet and Saturday’s “ETFs on the Cutline” report for suitable ETFs to buy.
3. Trend Tracking Indexes (TTIs)
After struggling to sustain early bullish momentum for five consecutive days, traders finally experienced a sense of relief as the major indexes achieved a winning session on the sixth attempt.
The gains were robust and widespread, reflecting a positive shift in market sentiment.
Similarly, our TTIs mirrored this trend and ended the day on a higher note.
This is how we closed 01/03/2025:
Domestic TTI: +2.91% above its M/A (prior close +2.15%)—Buy signal effective 11/21/2023.
International TTI: +1.02% above its M/A (prior close +0.74%)—Buy signal effective 11/21/2023.
All linked charts above are courtesy of Bloomberg via ZeroHedge.
———————————————————-
WOULD YOU LIKE TO HAVE YOUR INVESTMENTS PROFESSIONALLY MANAGED?
Do you have the time to follow our investment plans yourself? If you are a busy professional who would like to have his portfolio managed using our methodology, please contact me directly to get more details.
Contact Ulli