
ETF Tracker StatSheet
You can view the latest version here.
S&P 500 RETREATS AFTER RECORD HIGH, BUT WEEKLY GAINS PERSIST

- Moving the market
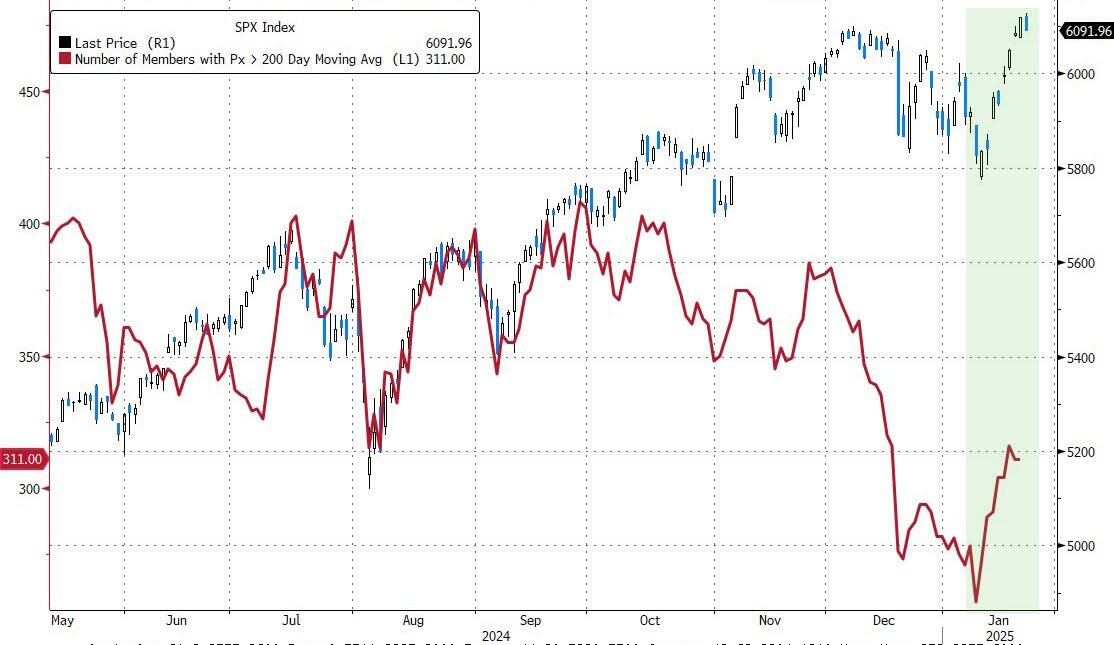
After reaching a new record high early in the day, the S&P 500 retreated but remained close to its unchanged line, positioning itself for a second consecutive weekly gain.
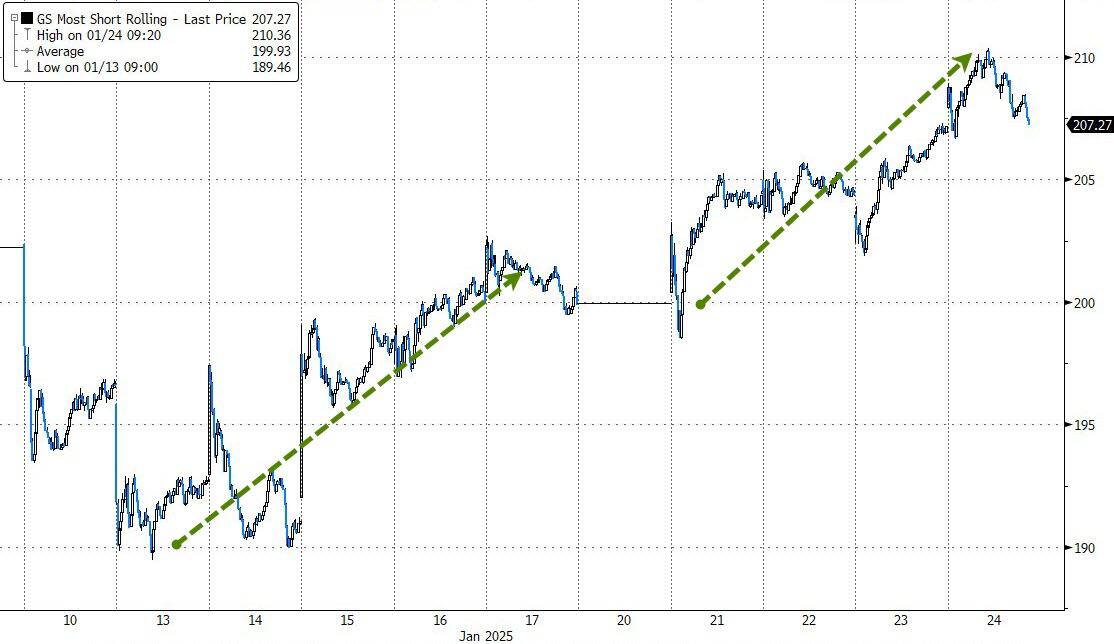
However, sentiment turned bearish by the end of the day, leading the major indexes to close in the red. Despite this, the week ended on a positive note, with market breadth improving significantly and the short squeeze continuing.
Equities benefited from pro-business policies, with traders relieved that the threat of tariffs has so far been limited to announcements rather than formal actions.
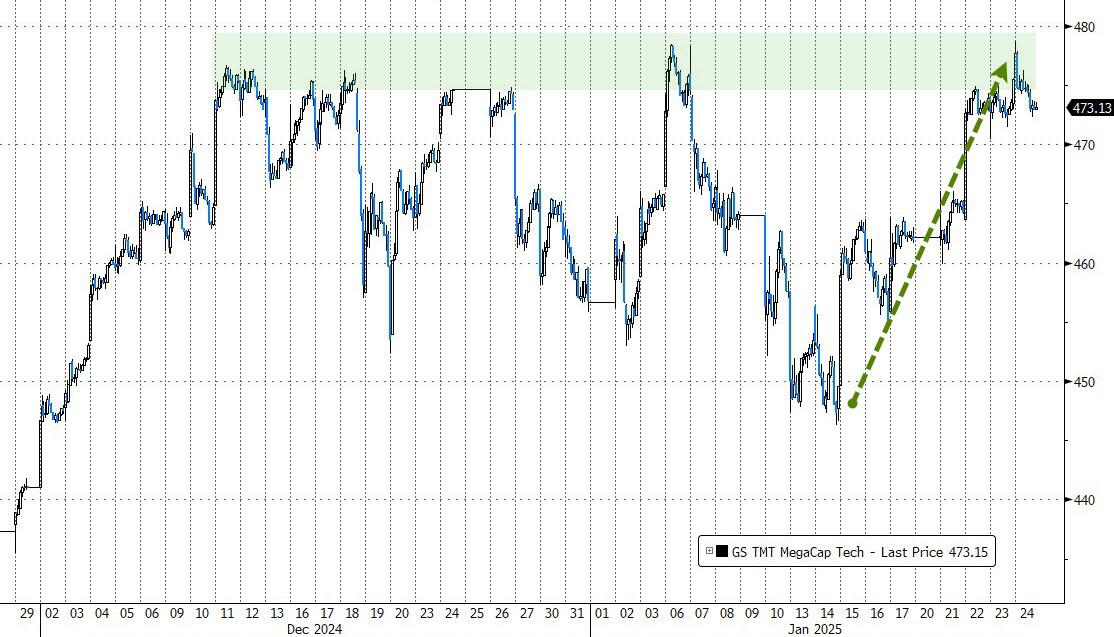
The mega-cap tech sector rallied for the second straight week, closing near its highs. The past couple of weeks have been positive, suggesting that the December pullback may be over and bullish sentiment has returned. This optimism is further supported by Trump’s demands for lower interest rates and a reduction in oil prices.
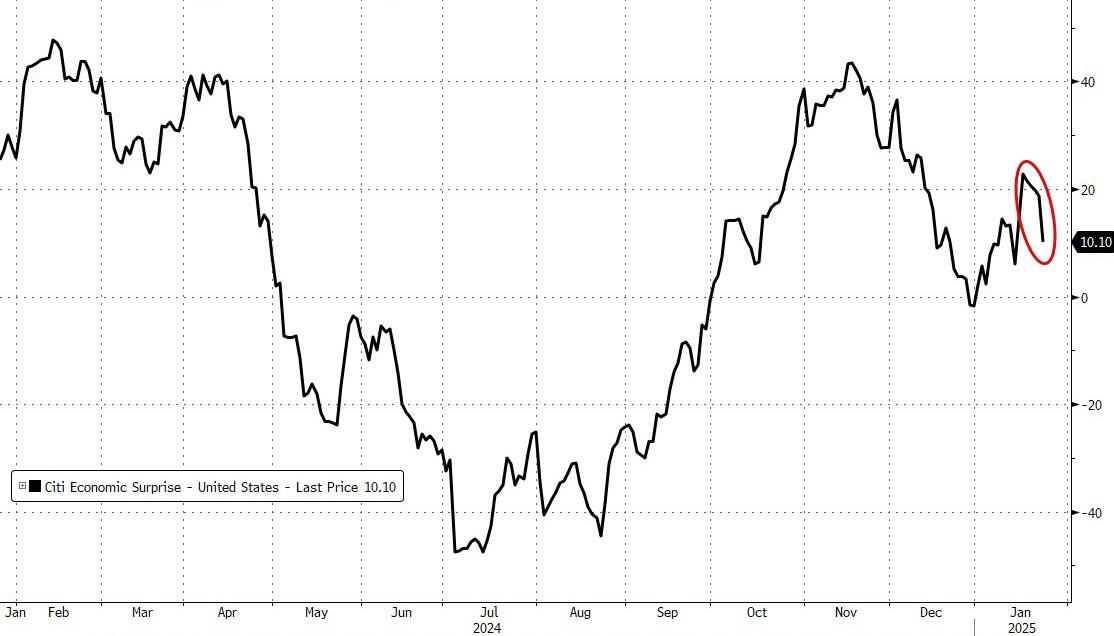
While macroeconomic data initially showed improvement, the week ended on a down note with a decline in services and rising inflation expectations.
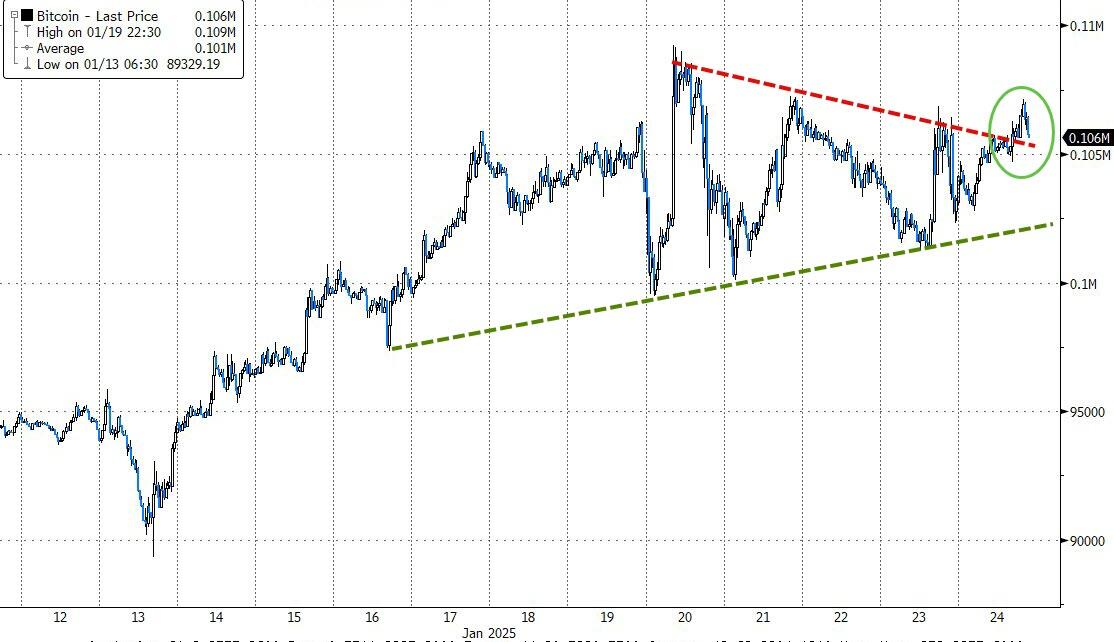
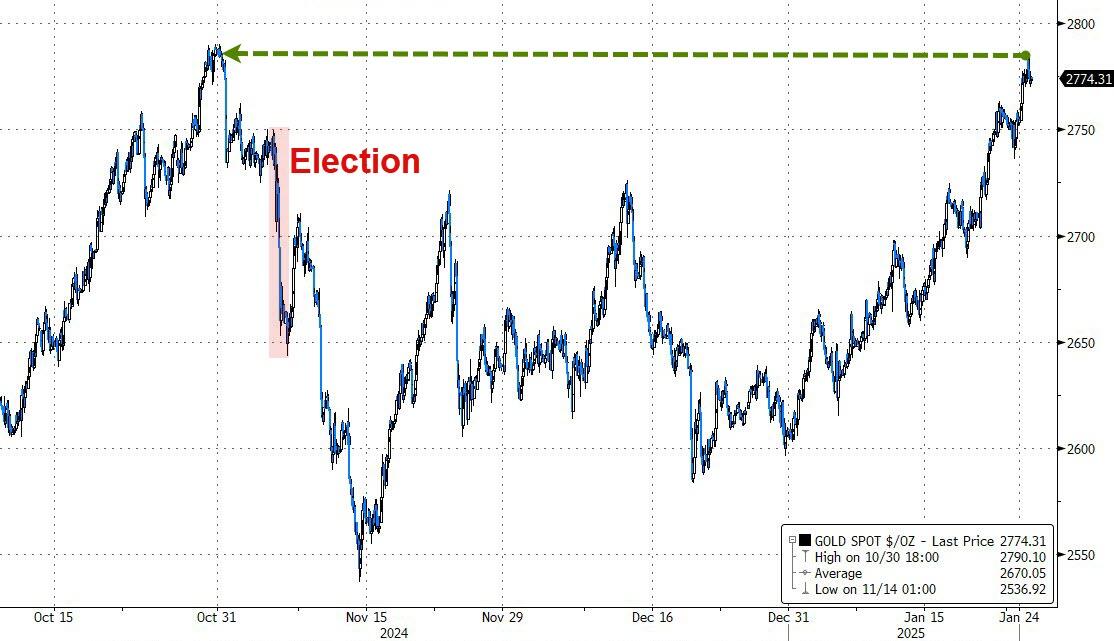
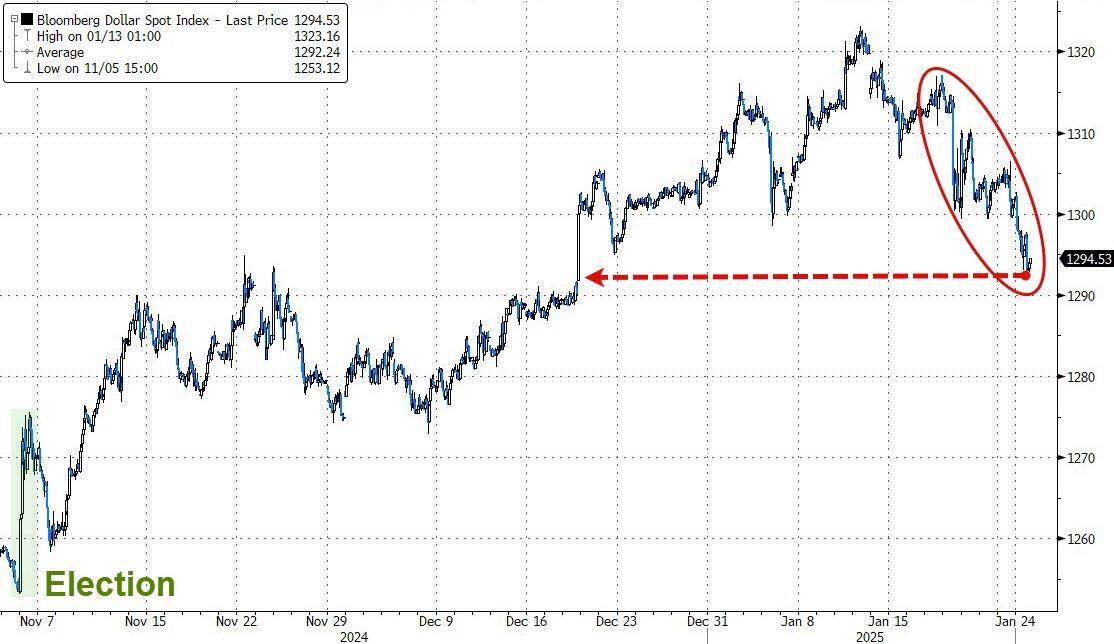
Bitcoin and gold extended their gains, with gold nearing its all-time high. Conversely, the dollar suffered its biggest drop since July 2023.
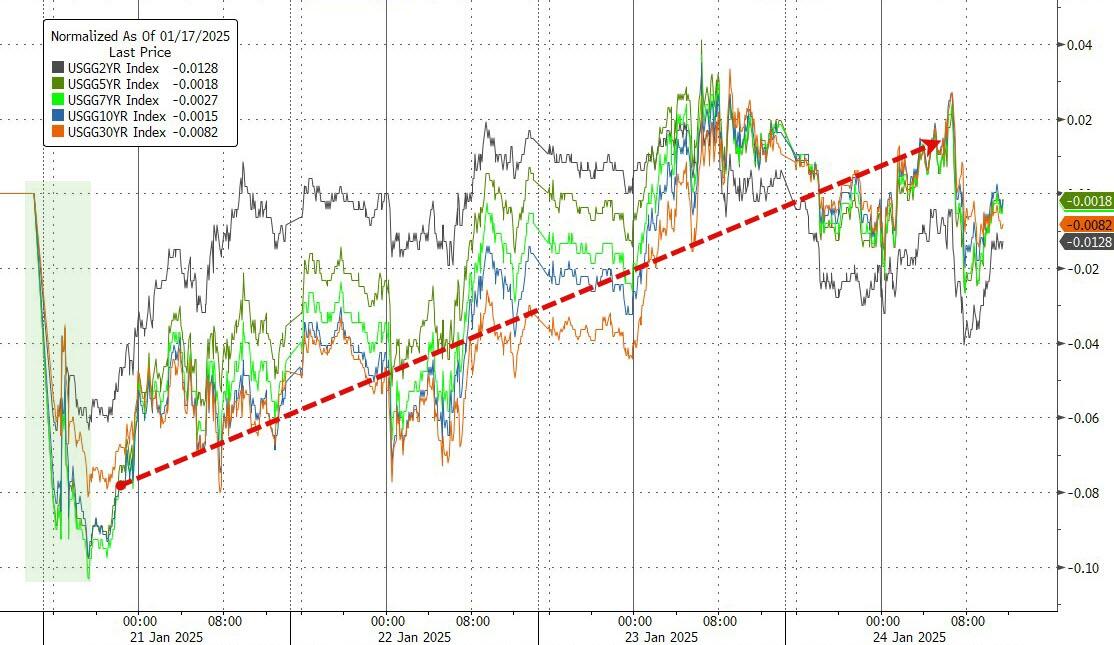
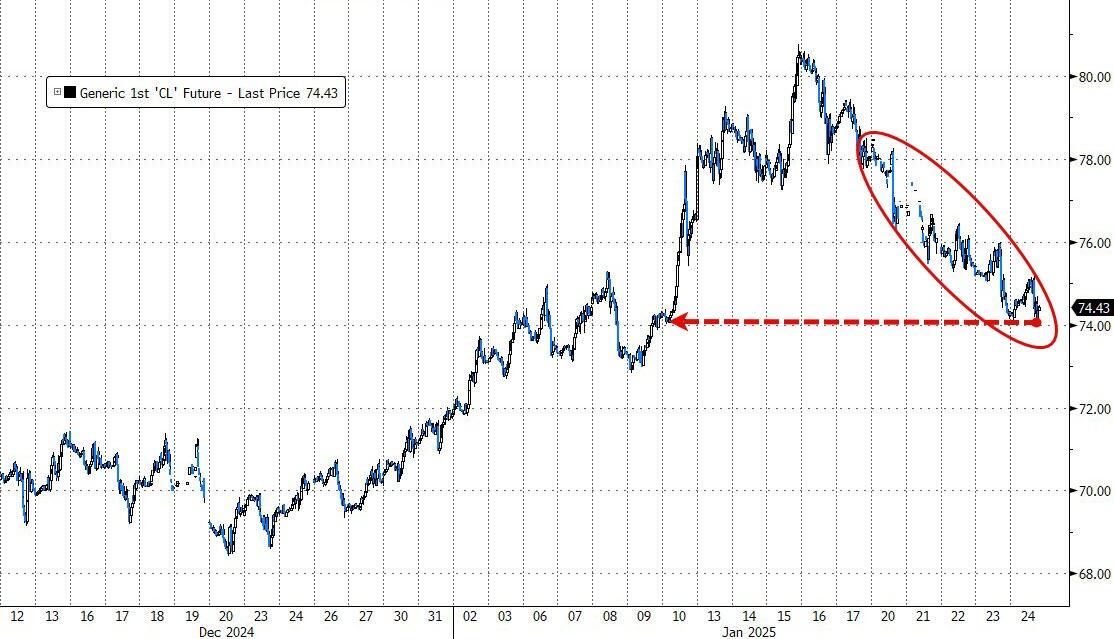
Bond yields, after a sharp drop last Tuesday, rallied back to close the week about unchanged. Crude oil prices experienced their largest weekly drop in three months and have been down for six consecutive days.
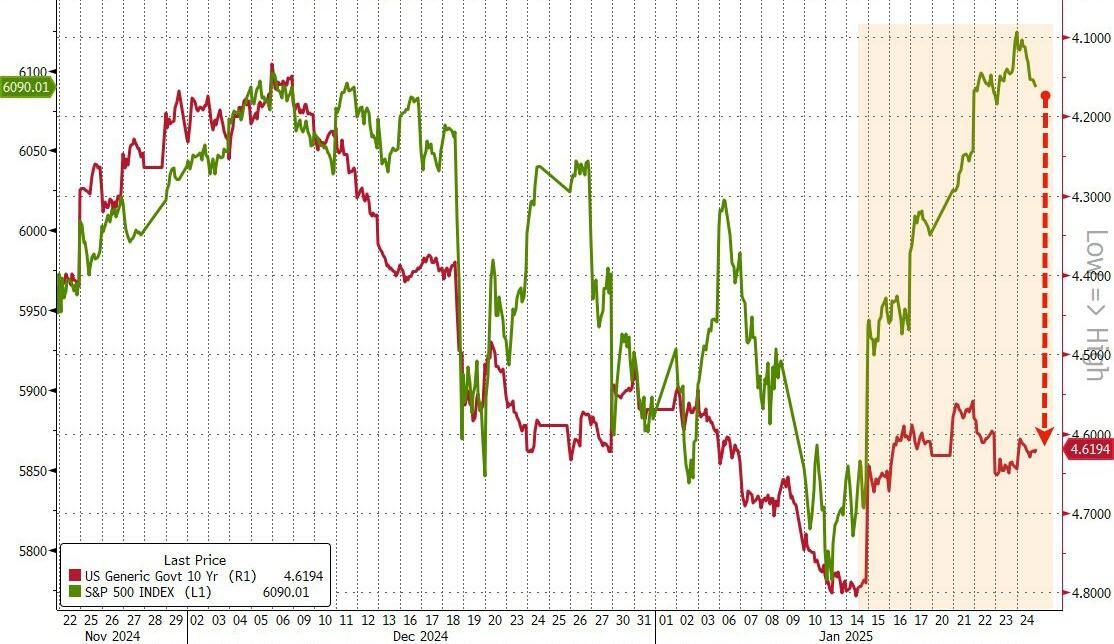
I find it interesting to observe divergences in asset classes that typically move in sync. Currently, stocks and bonds are presenting such a divergence, particularly when comparing the S&P 500 to the 10-year bond yield.
This chart highlights the current conundrum, suggesting that a correction in equities may be on the horizon.
Will history repeat itself?
2. Current “Buy” Cycles (effective 11/21/2023)
Our Trend Tracking Indexes (TTIs) have both crossed their trend lines with enough strength to trigger new “Buy” signals. That means, Tuesday, 11/21/2023, was the official date for these signals.
If you want to follow our strategy, you should first decide how much you want to invest based on your risk tolerance (percentage of allocation). Then, you should check my Thursday StatSheet and Saturday’s “ETFs on the Cutline” report for suitable ETFs to buy.
3. Trend Tracking Indexes (TTIs)
Although the major indexes began the day on a positive note, they eventually lost their upward momentum and closed in the red.
Despite this setback, the week’s performance was strong overall. The S&P 500 not only reached a new all-time high but also showed consistent gains over the past two weeks.
Similarly, our TTIs experienced a nice increase, though they did give back some of their gains during today’s pullback.
This is how we closed 01/24/2025:
Domestic TTI: +5.43% above its M/A (prior close +5.86%)—Buy signal effective 11/21/2023.
International TTI: +4.39% above its M/A (prior close +4.59%)—Buy signal effective 11/21/2023.
All linked charts above are courtesy of Bloomberg via ZeroHedge.
———————————————————-
WOULD YOU LIKE TO HAVE YOUR INVESTMENTS PROFESSIONALLY MANAGED?
Do you have the time to follow our investment plans yourself? If you are a busy professional who would like to have his portfolio managed using our methodology, please contact me directly to get more details.
Contact Ulli