ETF Tracker StatSheet
You can view the latest version here.
SEASONAL TRENDS HINT AT POTENTIAL MARKET DOWNTURN NEXT WEEK

- Moving the market
Traders viewed today’s jobs report as a “Goldilocks” scenario, where the data was better than expected but not so strong as to discourage the Federal Reserve from potentially cutting interest rates later this month. This morning, the odds of a rate cut increased to 88%.
In November, nonfarm payrolls rose by 227,000, surpassing the expected 214,000 and significantly improving from October’s modest gain of just 12,000. The unemployment rate edged up to 4.2%, aligning with current projections.
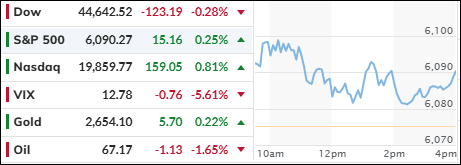
While this headline number impacts markets, it is likely to be revised, as has been the trend over the past year. Nevertheless, major indexes surged on the news, with the Nasdaq leading the charge and achieving a record close, while the Mega-Cap basket continued to gain.
Throughout the week, economic data generally fell short of expectations, which bolstered hopes for a rate cut. This dovish sentiment extended to the bond markets, where all yields declined over the week.
Bitcoin underwent its sixth consecutive week of gains, briefly surpassing the $100,000 mark for the first time before retreating to find support at $92,000, eventually rebounding to $102,000.
The dollar ended the week higher, while gold followed a similar trajectory but closed slightly lower.
Given the influence of seasonality on equities, we might see a downturn next week if historical patterns hold true.
2. Current “Buy” Cycles (effective 11/21/2023)
Our Trend Tracking Indexes (TTIs) have both crossed their trend lines with enough strength to trigger new “Buy” signals. That means, Tuesday, 11/21/2023, was the official date for these signals.
If you want to follow our strategy, you should first decide how much you want to invest based on your risk tolerance (percentage of allocation). Then, you should check my Thursday StatSheet and Saturday’s “ETFs on the Cutline” report for suitable ETFs to buy.
3. Trend Tracking Indexes (TTIs)
The market began the final session of the week on a positive note, but the initial upward momentum gradually diminished. By the end of the day, only the S&P 500 and Nasdaq managed to close in positive territory.
Meanwhile, our TTIs fluctuated throughout the session and ultimately ended the day with only minor changes.
This is how we closed 12/06/2024:
Domestic TTI: +8.55% above its M/A (prior close +9.02%)—Buy signal effective 11/21/2023.
International TTI: +5.21% above its M/A (prior close +5.55%)—Buy signal effective 11/21/2023.
All linked charts above are courtesy of Bloomberg via ZeroHedge.
———————————————————-
WOULD YOU LIKE TO HAVE YOUR INVESTMENTS PROFESSIONALLY MANAGED?
Do you have the time to follow our investment plans yourself? If you are a busy professional who would like to have his portfolio managed using our methodology, please contact me directly to get more details.
Contact Ulli