ETF Tracker StatSheet
You can view the latest version here.
STAGFLATION FEARS RESURFACE AMID RISING INFLATION AND BOND YIELDS

- Moving the market
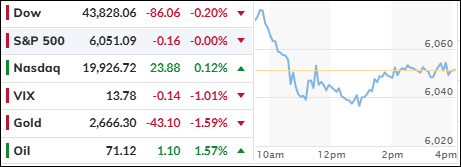
The tech sector saw modest gains, with the Nasdaq achieving its fourth consecutive week of growth. However, the S&P 500 and the Dow both experienced slight losses. As we near the end of 2024, the S&P 500 has recorded its best year-to-date performance since 1997.
Broadcom significantly bolstered the tech market, reaching a $1 trillion market cap and surging over 21% after reporting fiscal fourth quarter adjusted earnings that exceeded expectations, largely due to a substantial increase in AI revenue. The Mega-Cap tech basket also saw gains for the third consecutive week, despite a late-session sell-off.
Concerns about stagflation resurfaced today as inflation began to rise and the Citi Economic Surprise Index declined. Traders now believe there is nearly a 100% chance of another 0.25% rate cut next week.
Despite the Federal Reserve’s dovish outlook, bond yields have been rising rapidly, which has had a neutral impact on equities so far. The dollar continued its upward trend, marking its sixth consecutive day of gains, while gold maintained its weekly gains despite a pullback today.
Bitcoin ended the week above $102,000, finding support at the $100,000 level throughout the session. Crude oil performed well, rising on four out of five days due to increased geopolitical tensions.
Inflation remains a significant concern that could disrupt even the best-laid plans. This chart shows that the money supply has been increasing for about 18 months, suggesting that it is only a matter of time before CPI, PPI, and import/export prices accelerate.
The exact timing, however, remains uncertain.
2. Current “Buy” Cycles (effective 11/21/2023)
Our Trend Tracking Indexes (TTIs) have both crossed their trend lines with enough strength to trigger new “Buy” signals. That means, Tuesday, 11/21/2023, was the official date for these signals.
If you want to follow our strategy, you should first decide how much you want to invest based on your risk tolerance (percentage of allocation). Then, you should check my Thursday StatSheet and Saturday’s “ETFs on the Cutline” report for suitable ETFs to buy.
3. Trend Tracking Indexes (TTIs)
Throughout the session, the markets drifted without clear direction, ultimately closing nearly unchanged. Despite this, the major indexes experienced moderate losses over the week.
Similarly, our TTIs mirrored this trend, closing lower. However, this did not impact our overall positive outlook.
This is how we closed 12/13/2024:
Domestic TTI: +6.46% above its M/A (prior close +7.14%)—Buy signal effective 11/21/2023.
International TTI: +3.94% above its M/A (prior close +4.37%)—Buy signal effective 11/21/2023.
All linked charts above are courtesy of Bloomberg via ZeroHedge.
———————————————————-
WOULD YOU LIKE TO HAVE YOUR INVESTMENTS PROFESSIONALLY MANAGED?
Do you have the time to follow our investment plans yourself? If you are a busy professional who would like to have his portfolio managed using our methodology, please contact me directly to get more details.
Contact Ulli